Hi everyone,
I’ve spoken to a lot of you individually already, but it’s definitely time to increase the pace of communication, so we’ve decided to do an intra-month blog post.
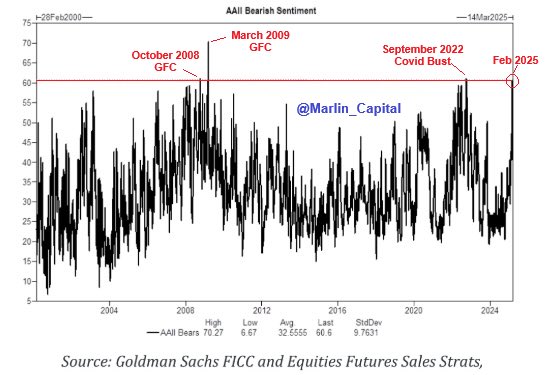
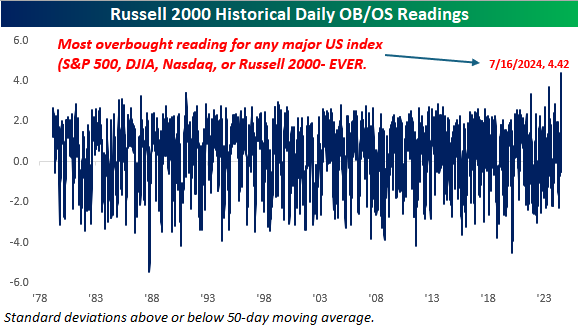
This past week was just the fourth time since 1952 (when five-day trading began) that we had a 10%+ two-day drop for the S&P 500. The other times? October 1987, November 2008, and March 2020. In terms of actual dollar value of the companies, it was, by far, the largest decline in the history of the stock market, surpassing 6.6 trillion dollars lost on Thursday and Friday.
This market is going to scare a lot of people. But remember that volatility and uncertainty is the price of admission to the stock market. Without short term pain there cannot be long term gains.
Try to avoid overreacting. Some will be tempted to move all to cash or make extreme moves. You’re not playing poker. You’re allocating your savings. If your portfolio feels like a casino you’re doing this all wrong.
So, what are specific things you should do in environments like this?
- Revisit your financial plan. If you absolutely must raise cash then do it, but not 100%. The average duration from a bear market bottom to new all-time highs is roughly two years. Move enough to weather an economic hurricane, but none more.
- Tax loss harvest. Consider swapping highly concentrated positions into similar, but more diversified allocations, or even the possibility of ROTH conversions to pay taxes up front on a lower amount and letting those gains grow tax-free vs. tax-deferred.
- If you are lucky to have excess cash, consider dollar cost averaging into the market.
- Stay the course, if you can. If you have a good plan in place, times like these should be almost irrelevant. If you feel tempted to make big shifts it probably means your risk profile is off.
- And the biggest one. TALK ABOUT IT. If you’re sitting on stressful losses or volatile positions, talk about it. Get advice and opinions. Don’t bottle it up and let it eat you.
The time to make money 2 to 5 years from now is today.
We are here to answer any questions, offer any advice, and even serve as a punching bag or a place to vent about the current state of the world. It helps. Trust me.
Talk soon,
Adam


