Beware Goldilocks

Our September 24th post entitled, When It Comes Time to Buy, You Won’t Want To“, we viewed the small dip that was occurring as a healthy pullback as well as detailed a couple reasons why it was a good buying opportunity (even going as far as mentioning 3600 as a possible year-end price for the S&P 500).

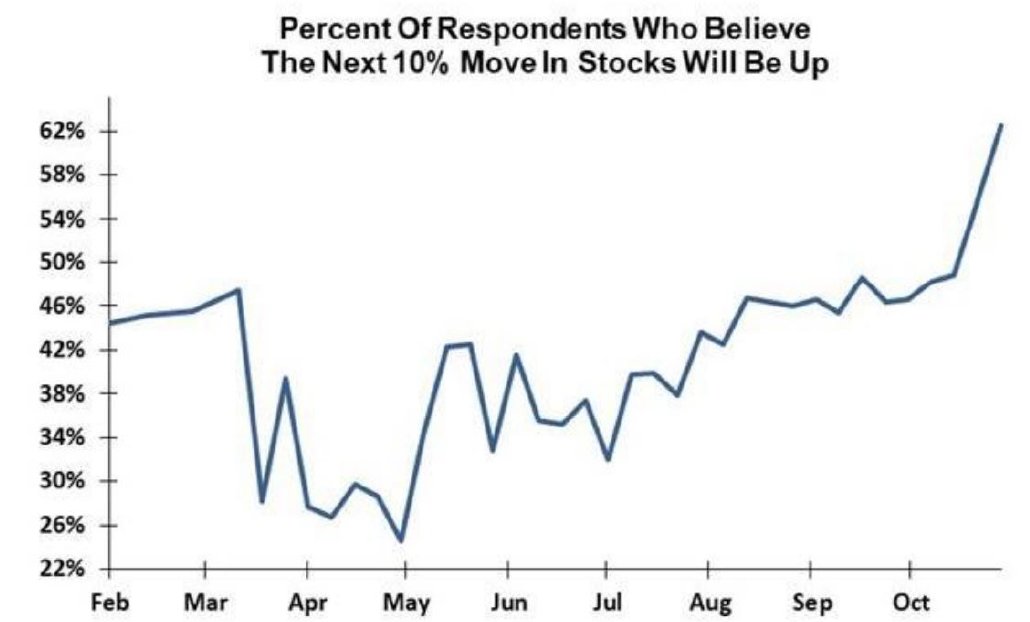
As we sit today, since 9/24, the Dow Jones and the S&P 500 are both up almost 12%, while the sentiment in the marketplace has completely flipped since prior to the general election.  Obviously with the prospects of highly effective vaccines coming in Q1 or Q2 of 2021, as well as the most accommodating financial conditions of the past decade, there is great reason for optimism.  Per Evercore ISI, in a survey of 303 institutional investors, 63% now believe the next 10% move in stocks will be up.

Image
Source: Evercore ISI. Past performance does not indicate future results.

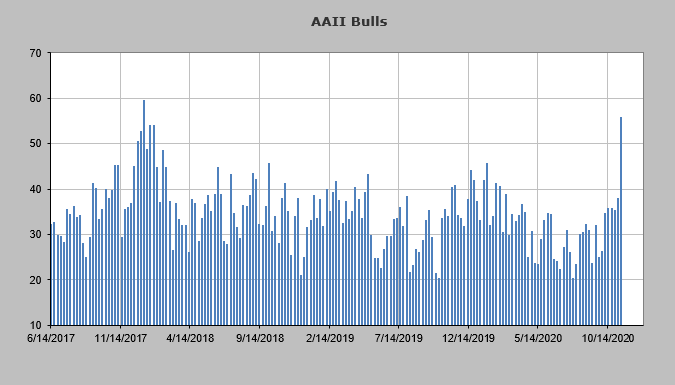
According to the AAII Sentiment Survey in mid-November, bulls had reached the highest percentage since January of 2018 (56%)

Image
Source: Helene Meisler, follow her on Twitter @hmeisler and read her at realmoney.com. Past performance does not indicate future results.

An oft quoted measure from previous blog posts is the CNN Fear and Greed index.  The index was 25 just before the election.  Today it’s 91.

When conditions look as though the stock market can only go in one direction, we start to get this feeling like things aren’t “too hot or too cold”.  This gives rise to the “Goldilocks” moniker.  From a financial standpoint, the base case appears to be

  • A Biden Presidency
  • A Republican Senate (Divided Congress)
  • No Massive Spending to Spook the Bond Markets
  • No Major Tax Hikes
  • A Ton of Liquidity and Near Zero Interest Rates from the Fed
  • Effective Vaccines
  • Return to Normalcy for Government

We are here to bring you back to earth.  We don’t think the next great depression is starting, but to ignore the sentiment froth in the marketplace right now would be a mistake.   If you’re looking to devote additional capital we would be very skeptical at this point.  If you’re thinking of additional capital needs over the next several months, we feel now would be a decent time to take advantage of the recent run-up, until fear starts to come back into the market.

As always, if you are curious about how this information affects your individual situation, please give us a call.

Be safe, be thankful, and be well,

Adam

Uncertainty

“The stock market hates uncertainty”.

Probably one of my most hated stock market axioms.  Everyone hates uncertainty but it exists at all times whether you believe it or not (like science).  If it’s clear to you what’s going to happen next, please give me a call.  I’ve been waiting almost 15 years now, and have yet to see it. 

As I told a client yesterday, the most fascinating thing to me about this particular stock market is that even if you told me the outcome of the election, I’m not sure you could make money off the information.  What this tells me is that the uncertainty surrounding the economy is multi-faceted, and in my opinion the virus trumps all (no pun intended).  When you find yourself in an emergency, whatever must be done eventually, should be undertaken immediately.  The unfortunate part about treatment and vaccines is that they are months away at BEST.  The stock market (and humanity) will cheer when the positive data is released, but this will just be step one in the eventual process of getting America back on its feet.  At present 7 million people are out of work.  This number will not go down in a substantial way until people FEEL it is safe to return and employers know they can protect their workers, vaccine or not.

For me, there are several checkpoints here that will lead to less uncertainty and this is what I’m watching:

  1. Election decision – I truly believe that the market will not care as long as the decision by the country is clear and accepted (but even that is in question these days)
  2. Vaccine and Treatment Data –  Regeneron and Gilead will likely both have emergency use authorization in the coming days/weeks ahead for their respective drugs.  To me, the Regeneron data appears to be more exciting because of its seeming ability to reduce the mortality risk.  There are still issues with the production capacity of this particular cocktail, but if it works, they will find a way.
  3. Fiscal Stimulus –  The agreement on both sides of the aisle that the American people need some help to bridge the gap during the virus is clear.  The lack of an agreement by this time, after acting so quickly and swiftly earlier this year, is disheartening, to say the least.  The inability for our government to compromise on something so pivotal to the literal and figurative health of our country speaks volumes about the dysfunction currently existing in DC.  While I understand the political calculus, I find myself growing even more cynical about our current state of affairs.  I choose to blame everyone.  Others may feel differently.  So be it.  

So how does this relate to you and your money?  I find the task of trying to navigate this particular market a fool’s errand.  But luckily there is another option…do nothing.  In this month’s edition of The 10th Man, by Jared Dillian, he outlines what I find to be the most pragmatic and simple explanation for how to accurately view what’s in front of us and how to prepare.  I would urge everyone to give it a read.

The 10th Man

The only thing I think I know for certain right now is that everyone is sick of this election cycle and hopefully things will get better after it’s over…but no one really knows that for sure either.

– Adam

“When It Comes Time to Buy, You Won’t Want To”

As we wrote in our late July post entitled Amber Light (link),

“The purpose of this note is not to alarm anyone.  There is a lot of data that suggests in 12-24 months we could be 20%-25% higher than where we are right now.  We just feel that the market is stretched and is due for a much needed pullback.  The pullback could be sharp and swift and just don’t want anyone to be unprepared.” – July 28th, 2020

In our opinion, we are getting the much needed and healthy pullback we were looking for, and are much happier to put new capital to work at these price levels, with the ever-present knowledge to be on guard for something more substantial.

Here are a couple of additional reasons why we feel the next 12 months might surprise us to the upside (3600 on the S&P 500 is not out of the question this year, regardless of what happens in November).

  1. Strength Begets Strength

The S&P 500 has had an historic run from the March lows and prior to last week had spent over 100 days above its 50-day moving average (a rolling average of the previous 50 trading days).  According to Ryan Detrick of LPL Research, since 1950 there have been 15 previous instances of this occurrence.  On average, the S&P 500 is up 8% over the next 12 months, while being positive 73% of the time.

Past Performance is not indicative of future results.

2. It’s Just That Time of the Year

Election seasonality has followed its traditional peaks and valleys very closely for the past few months, and kicked in almost perfectly at the beginning of September.  If the seasonal calendar remains accurate, the seasonal low (the best time to buy) come in the first week of October.

Source: Rennaissance Macro Research.  Past Performance is not indicative of future results.

3. Same Story Different Day?

During the advance from March 2020, the S&P 500 has experienced 4 separate pullback between 6-10%.  This latest pullback as of today’s intraday low is -10.55%.  In hindsight, each of those previous pullbacks was a good buying opportunity.  Will it be different this time?  Perhaps, but being aware of history and following its guide has stood the test of time rather than assuming things will be “different time time”.

Source: @vader7x.  Past Performance is not indicative of future results.

If you’re a long-time reader of our posts, you know that we encourage reading and education as much as possible, so I’d like to take a moment to urge those of your looking to increase your knowledge of investing to check out the most recent book by Morgan Housel, The Psychology of Money.  For my money, Morgan is the best writer (of any age) in the financial space, and I’ll leave you today with a quote from Morgan to always keep in the back of your mind…

“All good investing comes down to surviving an inevitable chain of short-term setbacks and disappointments in order to enjoy long-term progress and compounding.”

A special hat tip to Walter Deemer for the title of this month’s post as well.  Please stay safe and be well.

Adam


Investing in an Election Year

It’s been a heck of the month for the stock market.  The SPY (the symbol that tracks the S&P 500) has been down…*checks notes*…a total of THREE whole days this month. That is serious strength.  But naturally, the higher the market flies, the more worried some people get about holding onto their gains. I’d like to think it’s because of our expert instruction over the years, but it’s possible it just has more to do with innate human nature. Regardless, with little to worry about in terms of price and portfolio values, people naturally gravitate to the next glaring uncertainty: the 2020 election.

Also, it’s been quite a month for me personally (my wife got COVID…don’t worry, she’s on the mend), and I’m currently in the process of teaching a five and eight year old how to 1) sit still 2) work a Chromebook and 3) be patient. From my basement quarantine, it’s going about as well as you might imagine.

So, for this month’s blog post, I have decided to cheat a bit. Mike Antonelli of Baird Private Wealth Management has already done the homework and I would simply ask you to click on the link below.

Investing in an Election Year

Source: Capital Group Disclaimer: Past performance is not indicative of future results

We hope everyone is staying safe and healthy, and hopefully look forward to a strong end of the quarter in September.

-Adam


Amber Light

Although this month’s blog post sounds more like a beer preference, we would like it to be a bit of a cautionary tale.  As I was discussing the current market environment with a colleague on Twitter, he mentioned that recent market action reminded him of a note he sent to his clients in the mid-1980s entitled, Amber Light.  In a former life, he was the CEO of Prudential Equity Group, and while nothing had happened to force any portfolio changes for his clients, he felt there was enough anecdotal evidence to suggest market sentiment was getting closer to reaching stretched levels (he also happened to be right).

In our opinion, the stock market has been flashing a yellow light for several weeks now, and while ANY market indicators must be confirmed with price (better to be reactive than predictive), we now feel some of these indicators have turned more of an “amber” color (between yellow and red).

  1. The first indicator is the Citigroup Panic/Euphoria Model.  If you are an avid business journal reader, you may recognize this chart that comes out in Barron’s each week.  The first time the market had reached the euphoria level was in January of this year and was certainly a cautionary tale, but as you can see we have been squarely in the euphoric region for over two months.  There are no holy grail indicators in this business, but rather each one is the piece of the larger sentiment puzzle, which we attempt to decipher during each market cycle. 

  1. The second piece of the puzzle is the top-heavy nature of today’s market.  There is always clear leadership in the stock market and the larger companies will always have an outsized effect on market returns, but if the broader market refuses to participate in the rally, this concentrated growth tends to roll over.  The top 5 stocks in the S&P 500 make up more than 20% of the index for the first time in 40 years. (Chart: Goldman Sachs Global Investment Research)

  1. According to Ryan Detrick of LPL, there has never been a year in which the S&P 500 has been down 30% at any point in the year and finished the year positive.  Will 2020 be the first?  While there is a first time for everything (not unlike the entire year so far), we hesitate when our minds wander toward “this time is different”.

  1. The Nasdaq’s 20-day moving average has gone up 75 days in a row.  This is the 6th longest streak ever and each of the five previous streaks led to pullback in the NASDAQ and S&P 500 over the next month. (Per Jason Goepfert at SentimenTrader).

  1. Below is the 10-day average of the Put/Call Ratio.  This chart shows how many people are betting on the market moving lower relative to those betting that it will continue going higher.  The two previous lows on this chart were in late January 2020 as well as right before the 1869 point down day in the Dow Jones, less than two months ago.  (H/T to Helene Meisler of realmoney.com for the chart).

What does this mean?

For long-term investors?  Not much.  Until the primary trend for the major averages turns down, each pullback should be considered a buying opportunity, and for truly long-term investors, the market going lower in the short-term may actually be a net positive.

For those investors waiting to deploy cash that has been on the sidelines for one reason or another?  I believe that you will get your chance in the coming days/weeks.

For short-term traders?  Now is not the time to jump in with both feet, and those of you with individual trading accounts outside of your holdings with us, I would keep a very close eye on the markets for a tonal change.

The purpose of this note is not to alarm anyone.  There is a lot of data that suggests in 12-24 months we could be 20%-25% higher than where we are right now.  We just feel that the market is stretched and is due for a much needed pullback.  The pullback could be sharp and swift and just don’t want anyone to be unprepared.

As always, Brad and I hope everyone is staying healthy, and we are here if you need anything.

– Adam

The June Swoon?

Hello everyone, Adam here.

I’ve struggled to find a good topic for June’s post given how methodical (and unloved) the rise in the stock market has been over the past several months.  Since April 1st, the S&P 500 rose almost 31% over the next 68 calendar days.  Since then, it’s settled in nicely around 3000, which is not just an important psychological number for investors, it is also an important level technically speaking with the 200-day moving average currently sitting at 3021.

The tug of war in the marketplace continues and my honest thought is the market trades relatively sideways for another 3-4 months until more clarity exists around the two main issues.  I’d like to focus on consensus thinking and how the future may differ from the current “most likely” scenarios.

  1. COVID-19 – My general read at the moment is that a vaccine or a treatment is months away at best, and, at the moment, there appears to be a “second wave” of positive cases and increasing hospitalizations.  The market has priced in a bit of this “second wave” fear, but it remains to be seen if it is a temporary development, or if the worst is still in front of us.
  2. Presidential Election –  When it comes to predicting the future, the only real pieces of information I use come from Las Vegas.  Until I read something otherwise, the best handicappers of world events continue to reside in the desert.  At present, Joe Biden remains a small favorite, but by no means has anything been decided.  We have a long way to go until November, but I haven’t seen the markets really react one way or another just yet.  Generally, this starts to present itself much more clearly as we approach October and final decisions are made for positioning prior to election day.

As it relates to the stock market, I see risk/reward metrics slightly skewed to the upside (not the downside).  If the virus continues to get worse, the playbook will look similar to what we saw in the Northeast US, including strict lockdowns.  This will cause pockets of economic activity to come to a screeching halt, but I believe (as we saw in March), the continued coordinated fiscal and monetary policy solutions will float the economy for a bit longer (extension of unemployment assistance, zero interest rate policy, corporate and municipal bond programs, etc).

From a numbers standpoint, since World War II the S&P has been up 15% or more in a quarter 8 times.  According to Ryan Detrick of LPL, in all 8 instances the market was higher the next quarter, with the AVERAGE gain over the next quarter being 9.5%.  Not so coincidentally, the S&P 500 has about 10% more to gain from this price level to get back to where it was in late February (where the fear began).

Two potential positive catalysts are a viable vaccine/treatment, or a move back toward the incumbent candidate winning the presidency.  I don’t know what could happen, or why it could happen, but I just know that it CAN happen.  In my opinion, we should be on the lookout for GOOD news being the surprise here, not more of what we’re seeing on the evening news and social media.  This lends me to believe that pullbacks should continue to be bought aggressively until major price levels are breached (2850 area on the S&P 500 is BIG one if we make it there).

As always, we will reach out with Q2 performance numbers in the next week or so (spoiler alert: they are better than Q1).  Have a fantastic shortened holiday week, and please be safe over the weekend!

– Adam

Tug O’ War

The strength of the rally has been truly something to behold. The backstop from the Federal Reserve coupled with positive news on the virus front (flattening of the curve, hospitals not being overrun, treatment possibilities) has ignited a powder keg over the last 6 weeks. And while there is precedent for going back to test the lows again (2008), this has no longer become our base case.  This is currently the largest bear market bounce since 1950 (31% and counting for the S&P 500, per Ryan Detrick of LPL Research), so it begs the question, “Are we still in a bear market?” (I have no idea, by the way).

First, let’s take a look at what’s happening and not what we think is going to happen. Volatility remains and while I don’t think we’re going to all-time highs on the S&P 500 tomorrow, the pessimism regarding the future of America was as high as it’s ever been.  Those negative feelings have started to fade as stock market prices have risen, and I’m suddenly reminded that there is “nothing like price to change sentiment” – Helene Meisler (and it’s her birthday today!).  Coupled with a massive amount of people who flocked to cash over the last 6 weeks (per Bank of America/Merrill Lynch), this could be setting up for an even more epic rally.  For perspective, 7 times as much cash was raised in March, as compared to when President Trump was elected in 2016.

“The market is caught between two titanic forces: The Fed’s liquidity tsunami and the unknowable shape of the economic recovery. Thus far, the market has staged a normal rebound from the shock decline, and normal expectations (where I am) would be some sort of test of the March lows (although not necessarily a deep one) at some point. The BIG question is whether or not this environment is “normal'”.” – Walter Deemer.

The S&P 500 is down 9.6% year-to-date. The Nasdaq 100 is UP 5% year-to-date.  But it’s not just technology that has been outperforming.  Individual mega cap names (the biggest companies) in healthcare, retail, and pharma have all traded at or within 1% of their all-time highs over the past month.

Today’s stock market environment is exactly why we don’t try and time the market.  It’s too hard.  It’s why professional traders hold positions for days or weeks instead of years.  It’s why we’re spouting statistics about being close to fully invested at all times, in order to not miss out on the few days that really make a difference on the way back up (80% of the entire advance from the bottom has been in 4 trading days).  It’s why going to 100% cash is not investing.  Getting back into the market is always more difficult than selling your portfolio.

We rebalanced most client portfolios in late March and early April according to our methodology, and those positions have risen substantially. This maneuvering should allow your portfolios to return to high watermarks before the overall indexes. That’s its job.  Please remember that the market’s job is to frustrate the maximum amount of participants at all times.  From my own anecdotal data, the majority of individual investors are still bearish (although I have been getting some calls to “nibble” on some individual stocks).

From our previous posts and client communications we outlined the 2880-2900 area as our line in the sand if the market was going to turn.  Since April 9th (over a month) the S&P 500 is up less than 4%.  This adds to our feeling regarding the market being in a tug-of-war.

We still believe that the market will turn lower from this price range, but make no mistake, if the S&P 500 substantially takes out the high of last week (2955) on a weekly closing basis, we would expect the stronger sectors (Tech, Healthcare, Biotech, Communication Services, Semiconductors) to take out their all-time highs and we would turn bullish in the short term. 

This is a change in tone from recent posts, and if you’re sitting on the sidelines, you better have a plan in place if the market doesn’t give you another bite at the apple.  The way to make money trading in the stock market is simple, and Howard Marks says it best, “you have to be a contrarian, and you have to be right”.  The problem right now is that the sentiment picture isn’t at an extreme, so judging which way the wind is blowing remains difficult.

Regardless, for those of your with assets you’re waiting to deploy, we will be reaching out individually to make sure everyone is on the same page. 

Lastly, none of this matters without your health, so please stay safe, and I hope to see everyone in the very near future.

– Adam

And The Band Played On

The title of this blog post comes from the 1990s HBO docudrama starring Matthew Modine as epidemiologist Don Francis.  It is based on the true story of the CDC as they first came into contact with the HIV virus in the early 1980s.  It happened to be one of my father’s favorite movies, so it became one of my favorite movies (funny how that works).  If you have a chance (and I know you do), see if you can find the movie and give it a watch.

In the movie, the mantra of the CDC when dealing with this previously unknown type of virus was simple, “What do we think? What do we know? What can we prove?”

I use this method often when analyzing markets. Let’s go through the exercise together.

  • What Do We Think?
    • We think that life on the other side of Coronavirus will look different than it did before.
    • We think small businesses will not return to the same importance for the overall economy and large corporations will become even larger.   Essentially everyone will be spending money at the same four places (Grocery Store, Online/Retailer, Healthcare, Technology).
    • We think that we will be ushering in an increasingly digital workplace and world.  This had already been happening and perhaps this will just speed up the process.
    • We think the stock market is disconnected from reality since it’s not properly reflecting an economy working at roughly 50% (if the stock market reflects the economy, why aren’t stocks down 50%??).

All of these items sound pretty logical.  But the market doesn’t care what anyone thinks, including me.  It’s truly irrelevant, and even if we were lucky enough to predict exactly how the economy would look in five years, would you be able to profit from it?  “The stock market is a second level thinking mechanism (there’s that phrase again!). While most of us see the world for what it is, the stock market is always trying to see the world for what it might become.” – Cullen Roche

Based on what large institutions think, they buy companies that they believe will profit the most in the coming weeks/months/years.  Are they right?  Even they don’t know that one…

“If you’re confused or upset by the stock market action, just sit with it. Let it marinade on you. Learn to be comfortable being confused and uncomfortable. That’s way more productive than desperately searching for logic. There is no logic. Start there, and be free of the need to understand.” – Tom Canfield

  • What Do We Know?
    • We know there are 152 million American workers.  We know 22 million of them lost their jobs in some capacity over the last month.  That number is likely to move above 25 million, but we won’t know until tomorrow.
    • We know that central banks and governments throughout the world have intervened in an unprecedented way to try and avoid/alleviate a recession or even a depression (full employment is one of the two Federal Reserve mandates).
    • We know March was the most volatile month for the S&P 500…ever.
    • We know that sentiment reached pessimistic levels not seen since the global financial crisis. 
  • What Can We Prove?
    • We can’t prove much about the future, so we look to the past to show us what’s happened in previous periods similar to this one.
    • The S&P 500 has gained 15.5% in the last two weeks.  According to Ryan Detrick of LPL Research, since World War II, the S&P 500 has gained more than 12% in a two week span three different times: October 1974, August 1982, and March 2009.  One year later the S&P 500 was up 22.9%, 37.3%, and 51.7%, respectively.
    • The market remains highly bifurcated into big winners and losers.  Over the past 12 months, the largest companies (S&P 100) are up 2%, while the smallest companies (S&P 600) are down 24%.
    • On one particular day last week the Nasdaq 100 (technology sector) was up over 1% while the S&P 500 was down more than 1%…since 1985, this has NEVER happened.  – Jason Goepfert

“The only thing I have a strong conviction about right now, is that nobody should have a strong conviction about anything right now.” – Walter Deemer

There are many reasons to believe that the market will pause for a bit at this price level.   As we outlined in an email to clients at the end of March, the furthest rally for the S&P 500 we were prepared for was 2880-2900.  The intraday high price last Friday was 2879.22.  Close enough.  While we are still in the “retest the lows” camp, we must admit that if we are to deviate substantially above the 2900 level, the likelihood of a “V” recovery increases.

There is more volatility to come, so please don’t get complacent and think everything has been solved.  We still believe this will be a months/years long process for main street to get back on its feet.  But that doesn’t have to mean anything as it relates to the stock market.  Also, don’t delve down the rabbit hole of pessimism either.  It’s a convenient rocking chair, which gives you something to do for awhile, but doesn’t get you anywhere.

Talk soon,
Adam

Phase 2 – Complete?

In our “Green Shoots” post, dated March 20th, we outlined our view of how the markets could react positively over the coming days/weeks ahead even though the markets looked bleak.  We believed that the market was oversold and was due for a rally from those levels.  I’m happy to report that since the closing price on March 20th, the S&P 500 has risen 19%.

In our quarterly performance reporting emails, we mentioned specifically that the area of 2720 was a natural point where sellers could return to the market to lighten up their holdings.  Today we reached this first checkpoint.  While the market can still move higher from here (positive breadth and volume have been encouraging in the recent days) and we’re open to the possibility of 2900 on the S&P 500, I do believe Phase 2 of the traditional crash cycle is coming to an end.  Phase 3, the eventual “retest” of the March 23rd lows, is most likely upon us.

Let me stop for a second and mention to everyone that there is no equation, no rule book, nor any secret decoder ring that predicts how this is going to shake out.  We only have history as our guide.  2008 was an outlier of a retest in the fact that it went BELOW the old low in March of 2009.  This also happened to mark a generational stock market bottom and a generational buying opportunity.  Most of the time, the retest ends up being within 4% of the old low (not necessarily a ” lower low”), but each time is a little different.

The real reason for this post is to give some guidance moving forward.  Today the S&P 500 reached the same price level it was in June of 2019.  This means that the return for the S&P 500 over the last 9 months is 0% (surprising isn’t it?).  While Phase 2 may be over, or may have a bit more to go, we are still in the camp of believing that the market will heading lower over the coming weeks.

So…if you’re a younger client and have a long time horizon, the traditional rebalancing (moving a small portion out of fixed income, into equities) remains our preferred method moving forward.  For those of you who are taking income from your portfolios and using it for living expenses, we’re going to try and take the opportunity on this rally to move up the quality spectrum and get a similar amount of dividend yield from companies we believe are less likely to reduce or eliminate their dividends, and hopefully we could see some capital appreciation eventually as well.

Ideally if you’re sitting on cash and feel comfortable adding to your existing positions, or have been waiting on the right time to jump back in, our recommendation would be to do so on the retest (at the moment we feel this level is around S&P 2400).

For those of you who find yourselves losing sleep about market losses, feel like you’re not able to ride out another storm due to age or potential job instability, NOW is the time in this cycle to sell some of your equity holdings to insure that in the highest number of probable scenarios, you’ll still get to where you want to be at retirement and beyond.

If you find yourself in this camp, please call or email at your earliest convenience.

– Adam

Green Shoots

Below are the types of conjecture I’ve been hearing and reading this week.  Generally, I look for certain phrases at market turns to help cement the idea that sentiment is hitting rock bottom (which is needed for stock market sellers to exhaust themselves).

  • “Why Would Anyone Want to Own Stocks Ever Again?”
  • “Buy and Hold Investing is Dead.”
  • “The Price of [insert commodity] Could Go Below Zero.”

While it may seem like all hope is lost, the zombie apocalypse is upon us, and capitalism is ending, we’re here to give you a few reasons why things under the hood might be a little better than you think.  It is our job to execute on the plans we’ve laid out prior to the crisis, and while you may not be very fond of us in three weeks, I’m fairly sure you’ll recognize the value of staying calm in three years.  Here’s a little bit of what I’m seeing to suggest we may have made, or are close to making, a intermediate low.  We don’t know if it’s “the” low, but there’s reason to believe it’s “a” low.

1. Valuation – According to Ed Yardeni, of Yardeni Research, Inc., the S&P 500 forward P/E Ratio (price/earnings) is roughly 13.5 (and was close to 20 earlier this year).  By this metric, the S&P 500 is back to similar valuations we saw in 2013 (even though price is only back to where we were 15 months ago).  These valuation levels could start to attract early buyers, but the huge caveat here is that we don’t know the impact coronavirus will have on the “E” part of this equation (earnings).  We didn’t have this information back in 2008 either, and we aren’t likely to get clarity for another three weeks or so until the banks start reporting the week of April 13th.

2. Daily Range Volatility – Via Macro Charts – The 10-day average range of the S&P 500 is now at 6.5%. This means the AVERAGE day, over the last 10, has seen the S&P 500 move 6.5% from its low to its high. That puts us in the top four all-time volatility events.  By the time we reached this level of volatility in 1929, the crash has already bottomed and a 62% rally ensued. In 1987, price had bottomed as well and the S&P never looked back. In 2008, we had already passed the Oct and November bottoms, but we did see a lower price in March of 2009.  It’s always possible we have more to go, but history suggests the bulk of the move is behind us.

3. The “Fear Index” – We had the highest close ever for the VIX (measure of fear and volatility in the markets). The last time this occurred was November 2008, and the market rallied 20% over the next five trading days.  Yes, the eventual low was in March of 2009, but in some markets, including the Nasdaq 100, a new low was never reached.  While we’re not in the business of calling a bottom, I do believe that the risk/reward to the UPSIDE is significantly in our favor.

4. Insider Buying – According to AlphaSense, of companies with a market cap above $1B, there have been 1,305 filings for stock purchases so far this month, compared with just 113 during the same period last year.

It would be foolish to not reiterate that markets can ALWAYS go lower.  Please respect and remember this.  The stock and bond markets are currently broken.  There are rumors of possible bankruptcies in places where it would have been unthinkable less than a month ago.  Combined with future speculation regarding overwhelming our current healthcare system, the need for massive amounts of respirators, and younger people not heeding the social distancing warnings, it seems like a never ending perfect storm.

But it will end.   And the stock market will likely bottom before the news gets better (hint: what non-market followers will perceive as bad news may actually be taken as good news because it could reduce uncertainty).  The market hates uncertainty and we have more than our fair share at the moment.  As more information unfolds regarding the dislocation in stocks and bonds, we should start to settle down.  The market just isn’t built to trade at this fever pitch for weeks on end.

The opportunity moving forward is NOT to catch the low tick of the market.  It’s to be around for the NEXT bull market.  That’s why we prefer index and sector funds to individual stocks.  Indexes don’t go to zero…

Stay strong (and healthy) out there and we look forward to communicating on an individual basis for the rebalancing plan over the next two weeks.

– Adam