March Madness

Hi all,

In case you’re not laser-focused on the happenings in the financial world, let’s catch you up to speed.  The second and third largest bank failures in history occurred this month with the receivership of Silicon Valley Bank (SVB) and Signature Bank (SBNY).  Confidence in the financial system has been shaken, but the Treasury department, the FDIC, and the Federal Reserve are attempting to reassure markets and stem the tide.  Their quick and decisive action to backstop uninsured depositors (over the 250K FDIC limit) was the right thing to do…for now.  The entirety of the unintended consequences can’t be known at this time, but there will be a price to pay down the road.  We’ll save that for another blog post.

So what happened?  Can it happen at my bank?

Firstly, no bank can withstand a massive run.  If everyone in the country shows up at Bank of America tomorrow and asks for their cash, it’s gonna be a problem.  It’s the reason that the faith and confidence in the banking system is so crucial.  So why did SVB fail?  A healthy dose of stupidity, with a dash of quirkiness.  Banks have an odd accounting rule that allows them to not mark down a bond if they intend to hold it to maturity. This effectively hides huge unrealized losses when interest rates rapidly move higher (bond prices and interest rates are inversely related).  When a bank has a problem and has to liquidate some of those bonds in order to meet demands for outflows, they sell what they can, not what they want.  At SVB, the percentage of their deposits above the FDIC limit was approximately 94%.  At Bank of America, it’s 46%.  At Charles Schwab, it’s 20%.  But what happens is that you end up with a deposit base that grew from $60B in 2019 to $190B in 2021 (mostly from the recent tech craze) and SVB ended up buying long term bonds paying 1.5%.  Flash forward two years and eight rate hikes later, you’re left with massive unrealized losses and a highly concentrated deposit base (startups and tech firms) running businesses which are bleeding cash.  In one week, $48B of deposits left the firm, causing them to sell their bonds at fire sale prices, realizing losses in excess of the entire value of the company.  Right now, it feels as though the problem is idiosyncratic, and somewhat of a fence is being put around select regional banks, but it’s not that simple.  ALL banks are sitting on massive unrealized losses because interest rates have risen so quickly.  The system needs time for these bonds to mature (years) and massage balance sheets to reflect the current interest rate environment.

That brings us to what this means for the overall economy and what it means for your money.  If you have a cash balance above the FDIC insurance limit with one financial institution, please fix this.  It’s $250,000 per account type, meaning you can have $250K in an account for you and 250K in an account for your spouse, making the total insurance coverage $500K.  Another alternative would be to transfer money into your brokerage account to purchase a money market mutual fund or short-term treasury bills (hopefully you aren’t getting tired of us asking you to do this as we’ve been doing so for the better part of the last 12 months).

Most interest rate hiking cycles end when something breaks.  The problem right now is that the FED is stuck between a rock and hard place.  They massively raised interest rates to fight inflation (a real danger), but in doing so, caused financial system instability.  The million dollar question is whether or not the FED will pause their interest rate hikes to let the “long and variable lags” of monetary policy work their way through the system, or do they believe this was a “one-off” problem that can be dismissed and continue on their path to tackle inflation. Time will tell.

As the saying goes, “When the tide goes out, only then do you realize who isn’t wearing a bathing suit”.  Is it a few bad actors, or a sign of things to come?  It all depends on how much longer the FED wants to lean on the economy to get inflation under control.  This week there is potential for another rate hike, and unlike any meeting in recent memory, there is massive uncertainty about what they are going to do.  Some analysts think they should continue on their path.  Some believe they should pause or even CUT rates with recent bank failures as proof they’ve gone too far.  My honest guess is that the FED will try to have its cake and eat it too.  They will raise another .25% next week, but the commentary surrounding the rate hike will be a clearer timeline of when they intend to pause.  This should give the market a little more clarity, which it desperately wants.

Either way, we’ll be watching.

– Adam


Ups and Downs

Hi all,

In our last post, we spoke about our view that a new bull market had started.  Since the close on January 12th, the Nasdaq 100 rose 12.4%, while the S&P 500 rose 5.3% and the Russell 2000 (small caps) was up 7.23% at their peaks, respectively.

We also attempted to stress that this does not mean there won’t be pullbacks and we don’t think that we’re headed for all-time highs in 2023.  In fact, in the first three months following a breakaway momentum signal, the average decline in percentage terms is 5.6%.  And while it’s always possible the market falls further and we take out the October lows, it would be unprecedented.  On February 15th, the S&P 500 closed above its 200-day moving average for almost 4 straight weeks.  No prior bear market in history has made a new low after making 18 consecutive daily closes above its 200-day average. None.  If you’re betting on the market continuing lower from here, you’re implicitly saying “it’s different this time” (we don’t do that).

Combined with seasonal trends (see chart below courtesy of BTIG’s Jonathan Krinsky), a pause not only seems fitting after a stellar start to 2023, but also welcomed so that stocks can continue to make a base at this new price level and sow the seeds for the next advance.

Past Performance is not indicative of future results.

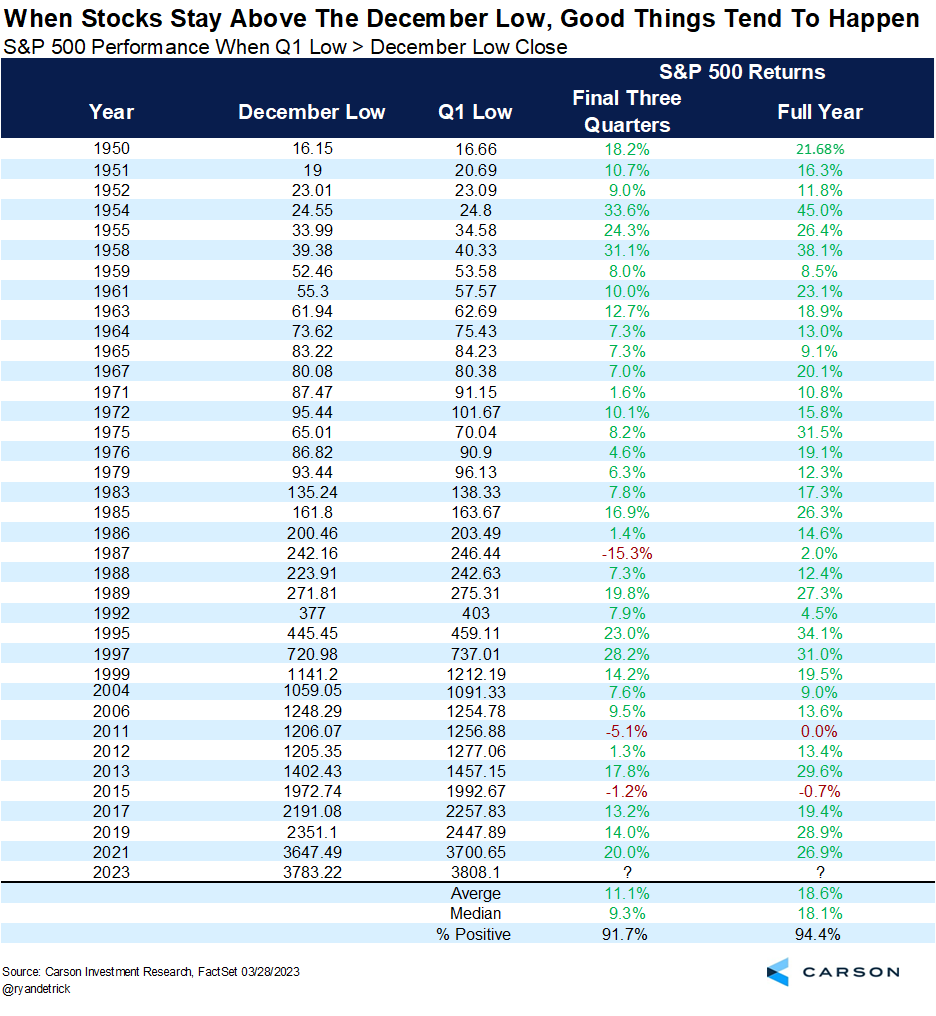
Even though we are looking for a bit of a pullback into mid-March, we believe historical trends remain on our side.  It’s a bit of cherry-picking the data, but a negative year for stocks, followed by a January that is up more than 5% has happened five additional times since 1950 (2023 was the sixth occurrence).  In those five other time periods, at year-end the S&P 500 was higher in all five, with an average full-year return of close to 30% (see chart below courtesy of Ryan Detrick from Carson Investment Research).

Past Performance is not indicative of future results.

Learning to get more comfortable with the ups and downs of the market is a huge step in being able to weather the storm.  After a great January, and a good start to February (not so much recently), try to zoom out and look at the bigger picture.

– Adam

2023: A Look Ahead

Hi All,

We’ve been purposefully waiting a bit to post this month’s missive in the hopes there was something big brewing in the markets.  Well, it turns out we’ve seen the first constructive, actionable, bullish signals in the past 24 months.

In January of 2022, we wrote,

“Over the past few years, our position has been some variation of “the trend is your friend”, but in 2022, we feel this is likely to change.”

While we thought 2022 wouldn’t be anything to write home about, the velocity and magnitude of federal reserve interest rate rises certainly caught us off guard in Q1.  The idea they would hike interest rates at the fastest pace in history was not something on our radar and our underperformance versus the overall market was a direct result.

But in April, we began to stress the need for patience, foreseeing a bear market rally that would eventually fade, leading to some additional pain.

“The possibility for another sharp advance could be in the cards, but our current view is that more frustration is ahead.”

In August, we rebalanced our more conservative and moderate portfolios, taking advantage of the summer rally by transitioning from municipal and corporate bonds into short-term treasuries, as well as lightening up growth equity exposure, as our tone and actions remained cautious, awaiting additional signals.

In our October blog post entitled, Where’s The Bottom, we wrote,

“Rather than picking a bottom (which is pure luck, even if we were to do it), here’s the conditions that need to occur for a bottom to be cemented.”

I won’t rehash the blog for the entire last year (although I do recommend going back and rereading, if you’re interested), but my point in highlighting some of the past commentary is that we believe the time for more aggressive positioning is upon us.

So what’s changed?  Underneath the surface of the market, a lot.

First, we achieved a “breakaway momentum” signal.  Below are the forward returns.  This is a signal that has only happened 24 times since 1949.  23 out of 24 times, the market has been positive a year later, and on average, 20% higher.

Source: walterdeemer.com. Past performance is not indicative of future results.

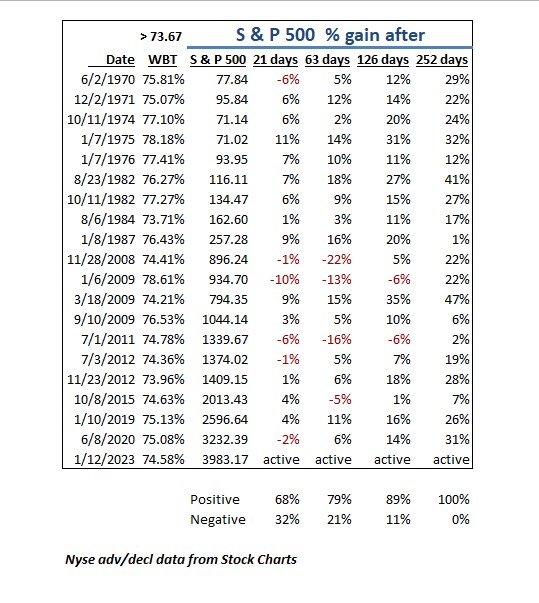
Second, is a different measure of breadth, but just as powerful of a signal.  This one is called a Whaley Breadth Thrust.  January 12th of this year marked the 20th occurrence since 1970.  The previous 19 were all positive one year later, with an average rise of 21.8%.

Image
Past performance is not indicative of future results.

What does this mean?  To me, it means the wind has changed directions.  Instead of being in a market environment where we take one step forward and two steps back (bear market), we are now entering a paradigm of two steps forward and one step back (bull market).  We believe the odds of allocating capital in this environment have switched decidedly in our favor.

Let me also stress what this doesn’t mean.  It does not mean that the S&P 500 will go up every day until we make a new all-time high.  It does not mean that there will not be periods of time where the market drops (sometimes substantially) and our confidence will again be shaken.  But having the anchor of history on our side does provide the confidence to start allocating more capital to sectors we saw exhibit relatively strength during the last half of 2022 (biotech, small cap) as well as sectors that remain in strong fundamental positions and prioritize returning capital to shareholders in the form of dividends or buybacks (energy, financials).

While risk remains our primary focus, we’re as optimistic about the upcoming year as we have been in more than half a decade.  If you’re willing to continue to place your trust in us, and come along for the ride, we believe the next 12 months will be full of surprises (good ones this time).

– Adam

2022 in Review

As we enter the “Santa Claus Rally” phase during the final five trading days of the year (as well as the first two of the following year), let’s look back on the trends of 2022, and think about what may come in 2023.

As you can see from the chart below, courtesy of Liz Ann Sonders, chief investment strategist at Charles Schwab, there have been very few places to hide.  After more than a decade of growth stocks trouncing value names, the unloved equities ended up with the last laugh, although December has been a month to forget among months to forget this year.

Image

The S&P 500 is on pace for the 4th worst year since the modern inception of the index in 1957.  Back-to-back down years have only happened during four distinct periods: The Great Depression, WWII, Stagflation of 1973-1974, and the Dot Com Bust.  Maybe we’re in one of these periods, it’s certainly possible, but not my base case.

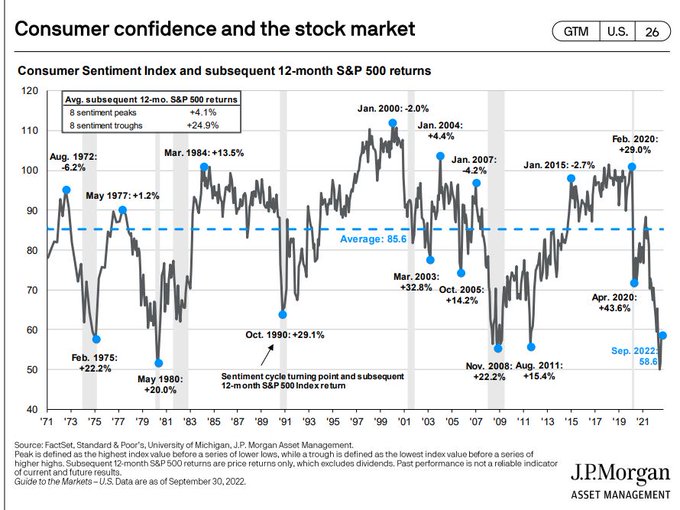
Bears have outnumbered Bulls in the AAII sentiment poll for 39 consecutive weeks (since April 7).  That’s the longest streak since they started tracking the data in 1987.  The University of Michigan’s Consumer Sentiment Index has been below 60 for 8 consecutive months, the longest streak since they started collecting data in 1952.

Why do I even care that everyone is so bearish?  Why do I even follow these statistics?  Because, in general, the markets vacillate between “the sky is falling” and “irrational exuberance” (guess which one is it right now).  But in the real world, things usually stay somewhere between “pretty good” or “not so great”.  The chart below shows what happens when the market decides (some day) the sky ISN’T falling, and realizes, once again, this too shall pass.

Image

This past week, Guggenheim’s chief investment officer, Scott Minerd, had a massive heart attack during his routine morning workout and died at the age of 63.  Late last year, Citi’s beloved strategist, Tobias Levkovich, was struck by car and passed away at the age of 60.  The last three years have brought more death and sickness than most of us have experienced in our lifetimes.  During this holiday season, while we preach to have a longer-term outlook on your financial life, please remember how relatively short our time here can be.

We will be sending out our 2023 outlook early in the new year, so be on the lookout, but until then…

Happy Holidays and Merry New Year to all!

– Adam

Thanksgiving

Thought I would switch it up this month and take a little time away from the markets (they will be there next week, don’t worry) to give some perspective to our overall lives.  For this month’s missive, I’m going to pick out a few pieces from Bob Seawright’s latest post.  Bob is a financial writer, but almost always with interesting tidbits about the intersection between life and wealth.  His newsletter, The Better Letter, is read by thousands, and I can’t encourage people enough to sign up here.

Contrary to doomscrolling on Twitter, or even the nightly news, by almost any measure, just about everything today is amazing.

Yet no one seems happy.

The things that matter in terms of happiness are those you would expect: a good marriage, a loving family, personal autonomy, and being charitable.  As we sit around our Thanksgiving tables, please take a couple minutes, hug a few seconds longer, and just realize how astronomically lucky we all are.

– Adam

P.S. – Personal shoutout to my father whose birthday was yesterday, and a fun picture of us from the newspaper 30 years ago (!!).  Happy Birthday, Dad.


Where’s the Bottom?

It’s the number one question on everyone’s mind.

“Where’s the bottom?!?”

I don’t know.  I also know that no one else knows.  So assuming NO ONE on the planet can predict where we might go next (although I’m certain some of you are SURE the market is going lower), let’s examine for a minute, what a major market bottom looks like.

Like many, I believe the S&P 500 will be higher, 12 months from now.  I believe this for many reasons.  They are outlined in several previous posts about negative sentiment, oversold conditions, historical numbers looking 12 months out from a large number of stocks making their 52-week lows, etc.  But rather than picking a bottom (which is pure luck, even if we were to do it), here’s the conditions that need to occur for a bottom to be cemented.  This is a bit more technical than some other posts, so if you’re my wife, you can stop reading here.

Since 1945, there have been 24 instances of a term Walter Deemer coined in the 1970s called “Breakaway Momentum” (also now known as a “breadth thrust”).  This occurs when ten-day total advances on the New York Stock Exchange (NYSE) is greater than 1.97 times the ten-day total NYSE declines.  It usually comes in three parts.  The first is the initial strong bounce off of major lows, which usually occurs during several days (we’ve seen a few of these “one-week wonders” recently, each one a hallmark of a bear market).  Secondly, during the middle part of the 10-day stretch, the market needs to HOLD its ground.  The real trick to achieving breakaway momentum is not to keep going up substantially everyday, but to keep the declines limited during the inevitable ups and downs that occur in any ten-day period.  Lastly, during days 7-10, the market again has a major bullish move (William O’Neil coined the term “follow through day”) to give the final signal that stocks have bottomed.

When we get into bear markets, investors lose their anchor (and their nerve).  There is no way whatsoever to know how low, nor for how long, the S&P 500 will go between now and that 12-month end point.  Maybe not much at all, but maybe a whole lot.

There will be re-balancing opportunities, and if you have cash on the sidelines, I urge you to remain patient.  When the signal is separated from the noise, you can bet we will be here to make sure we capitalize as much as we can from the ensuing rebound.

– Adam

Snap Back to Reality

Hi all,

As first alluded to in our post from April of this year,  patience remains paramount.  The massive accommodation to the economy from years of ZIRP (zero-interest rate policy) combined with the unprecedented fiscal stimulus during the pandemic created the “helicopter money” scenario made famous by Ben Bernanke during the great financial crisis of 2008.  For the better part of the last 15 years, we heard that gloom, boom, and doom, were headed for the United States as we would eventually have to face the music for leaving monetary policy so lax and for ignoring the past lessons of hyper-inflation from the Wiemar Republic and countless other examples throughout world history.

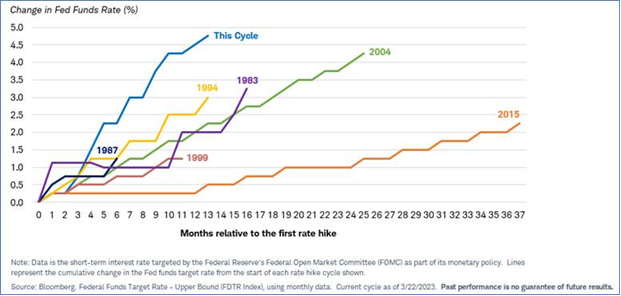
This year, we have begun to pay the piper.  The effective Federal Funds Rate, the rate at which banks borrow from the Federal Reserve (and which affects all other consumer rates), is now 3% after the Fed meeting last week.  The purpose of this is to combat inflation as well as mop up the excess liquidity in the system and get back to a monetary policy in which the Federal Reserve is neither helping (accommodative) nor hurting (restrictive).  The pace and magnitude of these Federal Reserve moves, at least for the last 50 years, has been the fastest on record.

Image

From the beginning of this year, we have seen a systematic flow of funds out of highly speculative assets such as cryptocurrencies, non-profitable tech stocks, pandemic darlings, and “meme” stocks, to name a few.  We believe the next excess to be eliminated will be quick stock market returns.  There is a collection of individuals in the stock market still looking to cut corners.  We believe in order for the stock market to gain solid footing and start to be priced based on fundamentals, we will need to see the weekly option volumes collapse, and the gamble (YOLO) mentality to fade.  In recent weeks, betting against the economy (and the stock market) has gained as much fervor in the opposite direction as we saw during the post-pandemic euphoria.  Here’s a couple charts to show how historically negative people have become.

Image
Past performance is not indicative of future results

To show the point a bit differently, if you were to eliminate each week of the month where options expire (typically the third Saturday of each month), the S&P 500 is almost unchanged for the year.

Image
Past Performance is not indicative of future results

Investors have even gone so far as to sell a greater percentage of equities during the past few months than they did at the depths of the great financial crisis.

Image
Disclaimer: Past Performance is not indicative of future results

What does all this mean?  For younger investors, or those of us who are still adding to our long-term portfolios, it’s actually good news.  If you make the assumption that the world isn’t going into the next great depression, these purchases at lower prices will end up being some of the most difficult ones to make, while at the same time, being some of the most profitable of your financial journey.  For those of you approaching retirement, we made a substantive change near the beginning of August, rotating out of bond funds, into shorter duration treasuries to ensure that the stable portion of your portfolio acts as a buffer.  And finally for those people taking income from their portfolios, it’s an opportunity to trade up in quality once again (just like in March 2020) to ensure stable dividend yields to help fund retirement expenses.

And just because I choose to be a bit of a glass half full type of advisor (this is more profitable over the long-run, trust me), there is a morsel of good data that we may be reaching a bit of an inflection point and a bear market rally may be in the cards, albeit after the early part of October.  In the past 10 years, when the amount of downside protection for individual stocks has outpaced upside bets on any given day, the average return over the next two months is 11.82% (but the bad part is that over the next two weeks, the average downside is -7%).

Image
Source: Jonathan Harrier, CMT. Past performance is not indicative of future results.

Hold your nose a bit longer and we believe your patience and resolve will be rewarded.

– Adam


Who Blinks First?

Hi all,

In our late June post, entitled Bear Market Rally or Something More?, we stated, “I think we tend to move a little higher from here and then we see how the market reacts.”  Since that time, we have rallied more than 500 S&P points (13%), before giving up about 7% over the last week or so.  So for our purposes, the “fear fever” has broken and investors are starting to breathe a small sigh of relief.

In both 2001 and 2008 (the major bear markets of recent memory), the stock market never rallied more than 50% of the decline once “the bottom was in”.  That level was 4231 on the S&P 500.  On a weekly closing basis, we closed at 4280 on August 12th (a feather in the cap of the bulls).  The problem here is that even IF the “bottom is in”, the short-term average and median gains over the next 20 days were -2.71% and -4.88% respectively.

What does this mean for you?  Our perspective at the moment is that the market has removed most of the negative excesses.  Price has actually risen so quickly, that almost all sectors are now in an “overbought” condition and in our opinion the market needs a bit of rest (which we’ve seen).  Per Charlie McElligott from Nomura, see the chart below.  Essentially we’ve gone from peak “fear” to peak “fear of missing out”.

Image
Disclaimer: Past performance is not indicative of future results

But as of this writing, we’re still sitting right in the middle of the massive range from the beginning of the year and there’s no discernible edge from a technical or fundamental standpoint until we get new information (inflation data, jobs reports, etc.).  It is entirely possible we move sideways until the midterm elections.

At this point, the sector most attractive to us from a supply/demand imbalance as well as a current yield perspective remains energy.  Energy firms have been decimated over the past several years and those that weathered the storm are built for survival at $40/bbl oil.  Even as crude oil has come down substantially from mid-June, we are still hovering near $90/oil.  It is likely the free cash flow yield (dividends + share buybacks) of energy companies in 2022 will be greater than it has been at any time over the past 30 years, while at the same time, publicly sticking to their relatively modest additional growth plans.  We believe this sector has potential for several years and getting paid to wait is never a bad thing.

It’s a bit of a small sample size, but during the recent rally, greater than 90% of stocks in the S&P 500 traded above their 50-day moving average.  Since 2003, there have been 14 such separate occurrences.  Looking one year out, the market has been positive 13 out of 14 times, and the average 12-month return is approximately 18%.  Our slight lean (no real conviction here just yet) is that the next pullback in the market (happening as I type), should be a very attractive entry point for clients where we’ve recently lightened up/rebalanced, or for investors with cash on the sidelines.

– Adam

Not About Where, But When

Hi all,

While we’ve had a nice bounce this month (as was expected), the outlook remains as clear as mud.  Here’s a couple things to think about on each side of the ledger.

Valuations

Image

At the June low, there was almost 12% of all companies trading on the NYSE trading at a market value below the amount of cash they had on their balance sheet.  This means that the stock market valued their respective businesses at $0.  As you can see from the chart above, these types of moves have signaled major bear market bottoms in the past.

Image

Small and Mid-cap company valuations are now well below the long-term average and currently below where we were in March of 2020, although not yet back to 2008 levels.

Defensive Posturing

Image

According to the Bank of America Global Fund Manager survey, cash levels are now the highest (as a percentage of assets) since 2001.  “Cash on the sidelines” it seems.

Workers

Image

According to ZipRecruiter, there are now 1.8 million more full-time workers than before the pandemic and 2.4 million fewer part-time workers.  When the government turns off the taps and interest rates rise, you can almost hear the collective refrain of “I need to get a better job” echoing in everyone’s head.

Historical Trends

Image

According to Jason Goepfert of Bespoke, the S&P 500 has never lost ground over the following 12 months when we’ve had advancing volume of greater than 87% for 2 out of 3 days in the first month coming off a 52-week low.  The median returns after this signal is 23% over the next year.

We feel the stock market is inadequately prepared for something to go RIGHT (for once in 2022).  This asymmetric risk/reward points to getting more upside out of good news, and less downside out of bad news (since everyone has already positioned themselves for the worst).  Because of this, we feel the issue going forward won’t be where we go, but when.  Given the Federal Reserve, at present, does not have any intention of providing accommodation to the economy (lowering rates), and a main goal of the administration is to combat inflation (lowering demand), it’s going to be very difficult for the market to gain its footing with its two largest market forces acting against it.  The thing to remember here is that the stock market is NOT the economy.  The stock market looks forward, while economic data looks backward.  It’s one of the main reasons we’ve seen the stock market increase in July.  Gasoline prices at the pump have come down over 10%, crude oil pricing is off almost 30% from its highs in March and those declines should start to come through in the inflation data starting this month or next.  The stock market is starting to sniff out that things are getting a little better, but will the market rise enough to entice that cash on the sidelines to start nibbling again?  We shall see…

Enjoy the last bit of summer and be safe out there.

– Adam


Bear Market Rally or Something More?

Hi All,

After our last post on May 26th, the markets finished their best week of the year with the S&P 500 and Russell 2000 rising 6.5% and the Nasdaq 100 up a little over 7%.

But since then, the S&P 500 has fallen into an “official” bear market.  Per Jason Goepfort of Bespoke Investment Group, it proved to be the first time the S&P ever failed so quickly after a 7% relief rally.  To be honest, regardless of whether or not the S&P 500 went down 19.8% or 20.1% means little difference to professional market watchers.  We ARE in a bear market, and in our view, it’s been a bear market for a little over a year (regardless of the major indexes holding up through most of 2021).  According to Bank of America, over the past 140 years, there have been 19 bear markets with average price declines of -37%, but more importantly the average duration of these bear markets (through the accepted definition) has been 289 days.  As far as seasonal trends are concerned, per the Stock Trader’s Almanac, Q2 and Q3 in midterm election years have been historically weak (although not as much in the last 10 years or so).

What does it all mean?  Should we expect a bounce, and use that as an opportunity to lighten up on stocks before they head back down again?  Will we see “traditional” capitulation?

The great financial writer for the WSJ, Jason Zweig, tells us that there are three ways to get paid to write:

    • Lie to people who want to be lied to, and you’ll get rich.
    • Tell the truth to those who want the truth, and you’ll make a living.
    • Tell the truth to those who want to be lied to, and you’ll go broke.

The truth here is that we don’t know.  Our best guess at the moment is that we are in for another substantial decline later in the year (a retest of the recent lows) to coincide with the seasonal trends, probably around 3400-3500 on the S&P 500 (essentially back to Feb 2020 levels).  I would peg my conviction of this view as 70% retest and 30% we start to base around these levels and make our way back toward all-time highs (I know, I know, blasphemy).

The case being made for us moving higher from here, but not going back down is gaining traction, but there are a couple main pieces to the argument:

    • Sentiment is still at historic lows.  But as of right now, sentiment has been as historically low levels for months, with very little movement back to the upside (and very little to be optimistic about).
    • According to the Bank of America Global Fund Manager Survey, the cash balances in customer accounts have risen to a level greater than April of 2020, the highest figure in the last 20 years.  This is potential fuel for the next advance as naysayers become believers when prices go higher, which is the exact opposite of how you should view investing.  The stock market is the only place I can think of where people get scared when stocks go on sale.
    • Most importantly are the historical comparables to what happens when the S&P 500 drops 15% or more in a quarter (this would only be the 9th time in history).  As you can see from the chart below.  The next quarter is up 6% on average, and is 15% higher on average over the remaining half of the year.
Image
Source: Markman Capital via Sentiment Trader. Past performance is not an indication of future results.

I think we tend to move a little higher from here and then we see how the market reacts.  While past performance is not indicative of future performance, past behavior is.  This is why during every cycle, the names and fears change, but humans don’t.  Buying into fear and selling into greed will stand the test of time.  The hard part is figuring out when the market is fearful enough and when it turns back to greed.

– Adam