Crosscurrents

Hi all,

As I sit at the computer right now, the equal weight S&P 500 (if you owned one share of each company) is currently down one quarter of one percent (-.25%).  The market has continued to be inundated with Q4 earnings, election primaries, and geopolitical tensions.  The market has responded with a resounding opinion: meh.

Let’s get a better idea of the push and pull playing out in the hearts and minds of the bulls and bears.

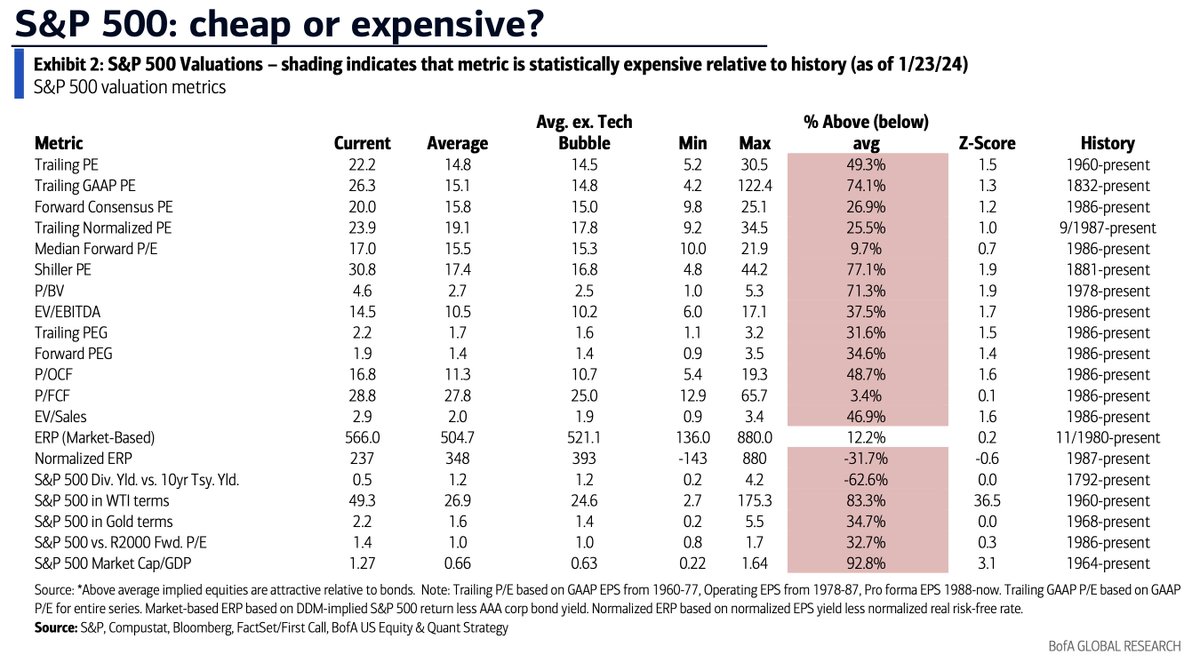
  1. The S&P 500 is statistically expensive.  On almost every metric, we are above long-term averages.  Whether or not the S&P gets cheaper or more expensive  from here is truly anyone’s guess.

    Image
    Past performance is not indicative of future results
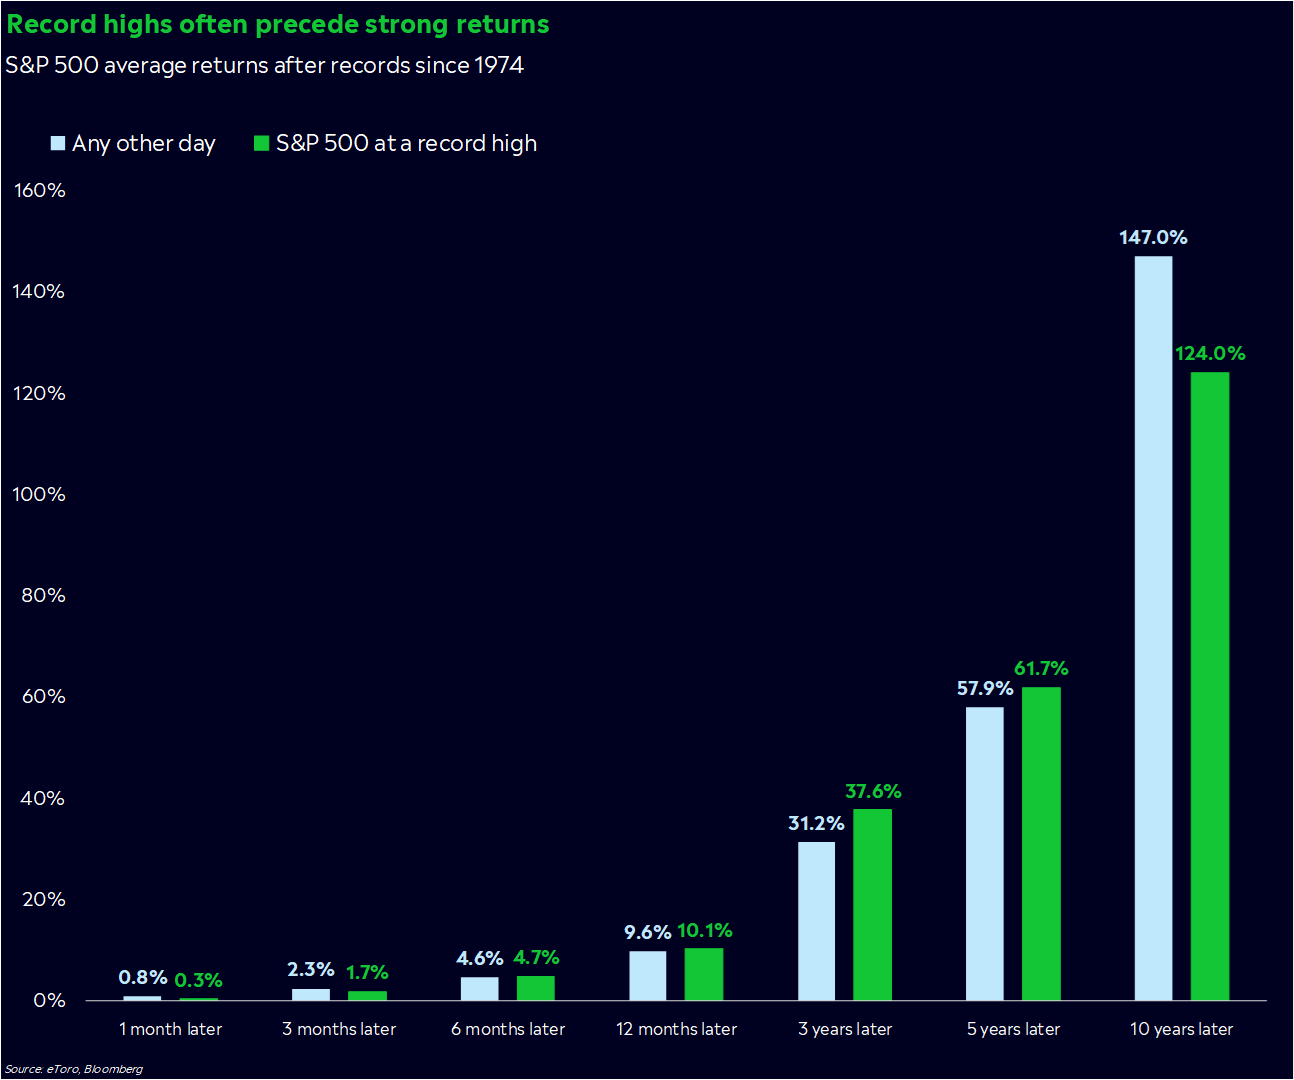
  2. The S&P 500 is at an all-time high.  The chart below from Callie Cox at eToro attempts to dispel the myth of investing at all-time highs. Counter-intuitively, in the financial markets, strength begets strength.

    Image
    Past performance is not indicative of future results
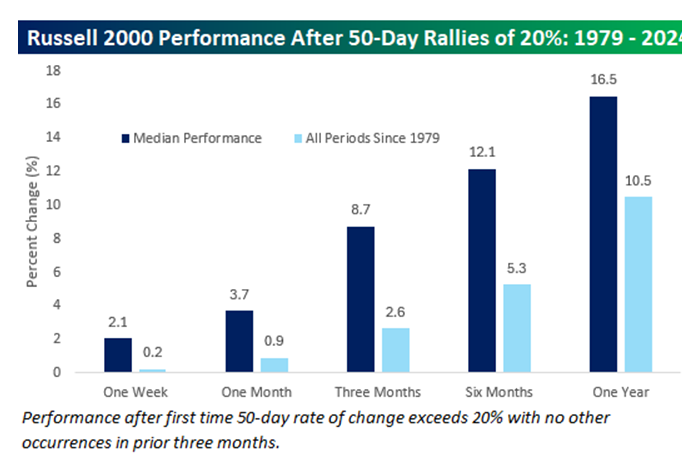
  3. Different than what we saw to end last year, leadership in the market has started to narrow (large-cap Tech and AI names have once again been the engine pushing the markets to all-time highs).  But while narrow leadership is a certainly cause for pause, history tells us that when small caps (Russell 2000) start a year with a decline of at least 4%, the median performance for the remainder of the year was 26.1%, increasing 6 out of the 7 times since 1979.  20%+ rallies like we saw at the end of last year, tend to lead to further strength in the weeks and months ahead.  Again, strength begets strength.

    Image
    Source: Bespoke Investments. Past performance is not indicative of future results
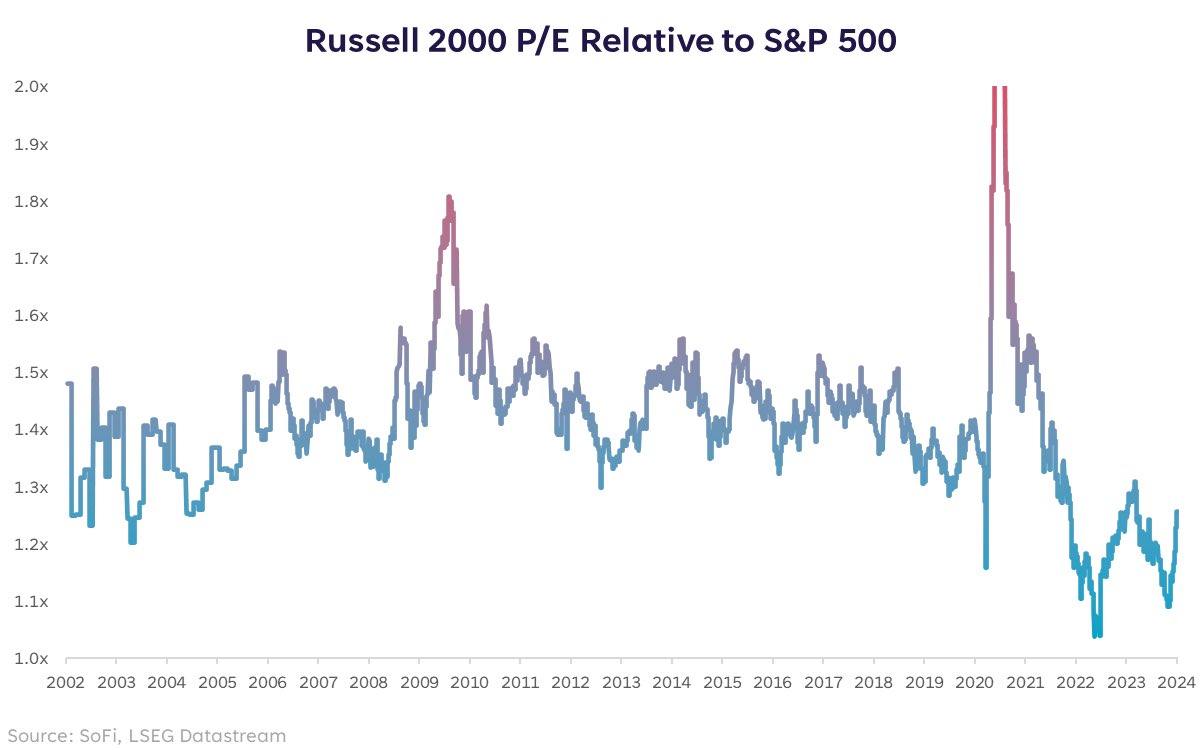
  4. We continue to recommend overweighting small caps (Russell 2000) and biotechnology for longer-term client portfolios.  Small caps remain cheap relative to the S&P 500, and the pharmaceutical industry is coming up to a patent cliff over the next five years that is 2.5 times greater than the previous five years.  We believe smaller companies with promise will likely start to get gobbled up by the larger firms looking to restock their pipelines.
    Image
    Past performance is not indicative of future results

    Image
    Past performance is not indicative of future results

In short, this is about as strong of an economy that anyone could expect after the Federal Reserve raised rates substantially over the past two years, but for some reason we (including us) are paranoid about the next shoe to drop.  There’s certainly a bit of froth that can be taken away from the stock market in the short-term (we’re counting on it), but perhaps we should start seeing the market for what it is: an overall reflection of things getting a bit better.

– Adam

Happy New Year!

Hi all,

As the page turns into 2024, we here at Second Level Capital are mostly filled with gratitude.  Gratitude for those clients who came to us in late 2021 and early 2022, and stuck with us through the roller coaster of the last few years.  Pride for our long-term clients seeing their portfolios near all-time highs.  Excitement for our business that continues to grow, and readiness to help more people in the coming year.

As for the market commentary, there isn’t much to glean just yet about how 2024 will shape up, but the transition we made for most clients in the fourth quarter of last year proved to be very profitable as the Russell 2000 went from a 52-week low on October 27th to a 52-week high on December 20th (one of the fastest moves on record).  Whether or not this value/growth rotation can be sustained is another question, but in terms of sectors, we continue to see opportunity in energy and biotech (to name a couple). Outside of those smaller areas, our conviction beyond a month or two remains pretty low. In similar times like these in the past, it has usually meant the market needs a bit of a breather to present more attractive buying spots.

As a heads up, we are likely moving office space this year (not quite The Jefferson’s), but more to come on that during future posts.

We hope that everyone had a safe and happy holiday season, and couldn’t be more ready to argue about markets with most of you in 2024 🙂

– Adam

Believe Nothing You Hear, And Half Of What You See

“This is investing, where the smart money isn’t so smart, and the dumb money isn’t really as dumb as it thinks. Dumb money is only dumb when it listens to the smart money.” – Peter Lynch

Media outlets love to sell fear.  Imminent recessions.  Spiking inflation.  The impending doom of commercial real estate.  But let me give you a little snapshot of what’s happening in the stock market (which is NOT the economy, please don’t get these two confused).

During the 18 trading days to start the month of November, the S&P 500 was +10.8%.  To paraphrase Steve Deppe, chief investment officer at Nerad + Deppe Wealth Management, there have been lots of 18-day stretches where the stock market has gained 10.8% or more (some of them during very difficult times in the stock market and the US economy).  But there were no 18-day stretches that closed 10.8% higher AND closed higher 15 out of those 18 days…until last week.  One could argue that we are currently in the midst of the strongest, most persistent advance we’ve seen in the past 30 years.

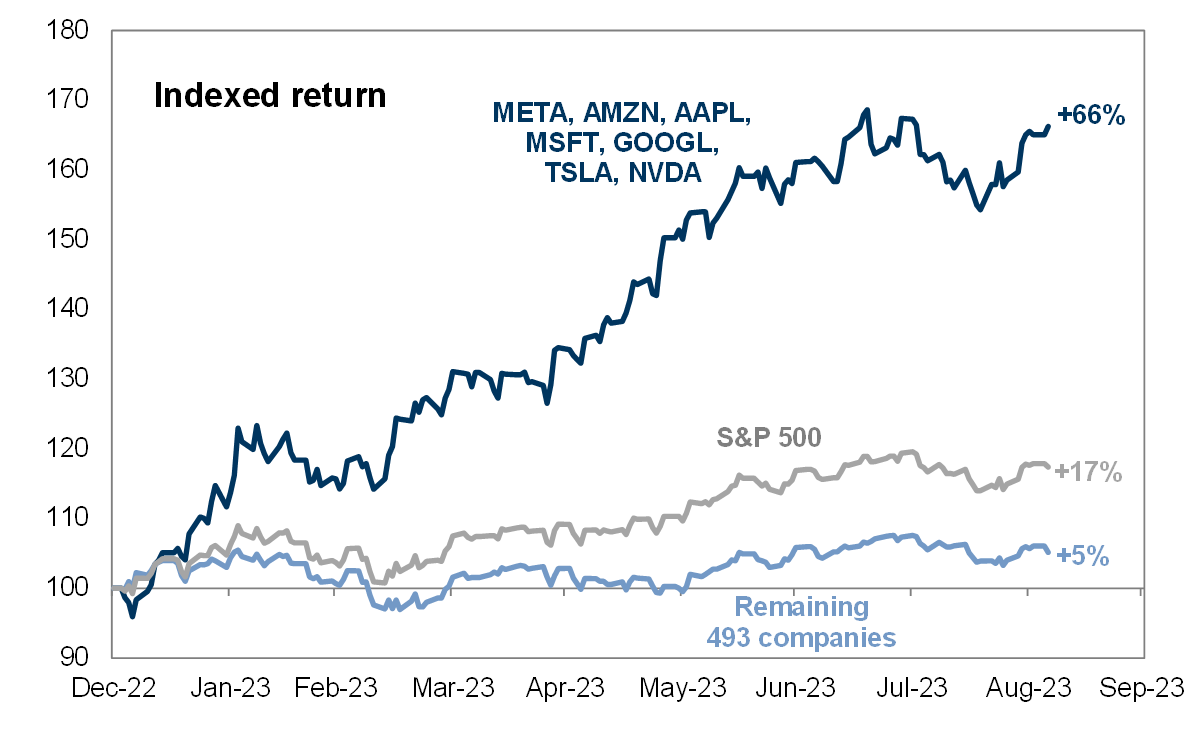
Obviously, a huge factor in the index gain has been the outperformance of the largest companies (the magnificent seven).  You might be asking yourself, “Then why don’t we have all our money in the best and biggest companies in the world?”.  Because in the last 65 full calendar years (1958-2022), market cap weighting beats equal weighting only 25 of the last 65 years.  Almost a full 2/3rds of the time, the average stock beats the big guys.  We anticipate 2024 could be a great year for mean reversion, in what I have seen referred to as “Team 493” (for all the other companies in the S&P 500 that no one cares to talk about these days).  We continue to recommend building a position in “the others” to capture some gains if/when people start to realize the lofty valuations of the stocks that have run up, and the relative value investing in quality businesses that have been unloved.

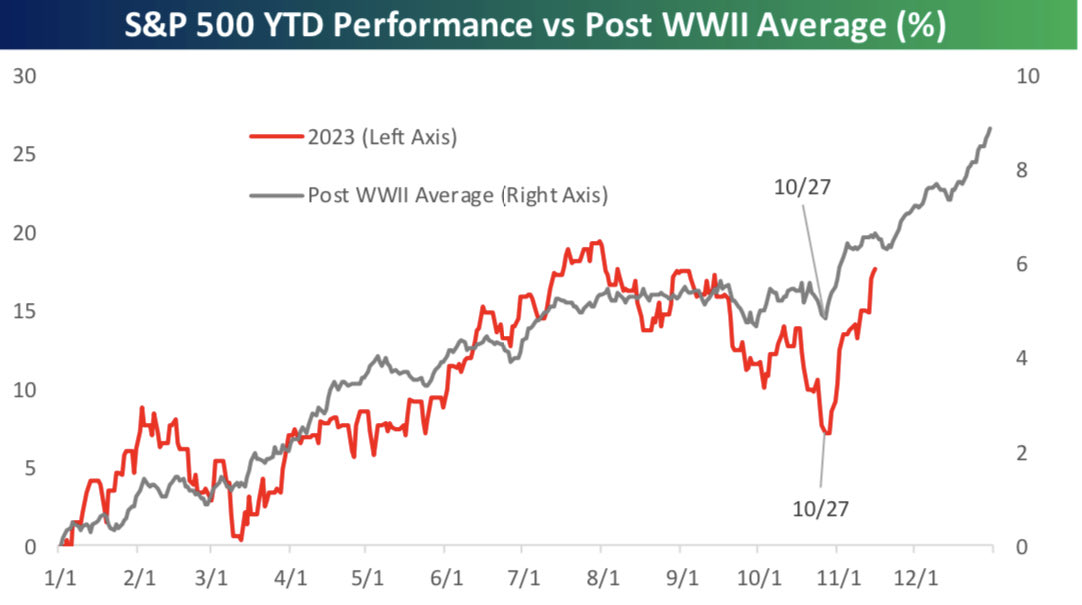
I’ve had several conversations with clients about how this year has been a real roller coaster.  Then I casually mention this year has been extremely typical.  This is usually followed by a period of silence where they wonder if I’ve been staring at my stock charts too long.  Well, see for yourself…doesn’t get any more typical than this when it comes to seasonal pivots and trends.

Image
Source: Bespoke. Past Performance may not be indicative of future performance.

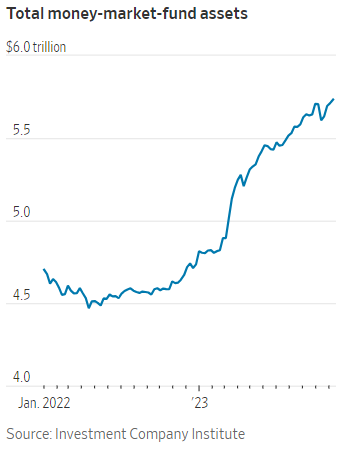
With the Federal Reserve pausing for three straight meetings, the market has sniffed out that as long as inflation continues to moderate toward its 2% target, unemployment remains low, and growth remains strong, it’s quite possible they will CUT interest rates in 2024 as the restrictive policy meant to temper the US economy will no longer be needed.  This still remains to be seen, but given the amount of cash that has flown into money markets over the past year, it’s possible the amount of interest you’ll receive over the next 12 months becomes a lot less attractive (reinvestment risk).  At that point, savers could be driven back into the stock market to get competitive returns.  Even if we end up going back toward January 2022 money market levels, that’s over $1 trillion dollars flowing back toward stocks over the next 12-24 months.  Will those dollars buy the “expensive” magnificent seven stocks, or will they go bargain hunting for additional current income to supplement portfolios?  We’re betting on the latter.

Image
Past Performance may not be indicative of future results.

While the stock market feels like it’s had an incredible advance this year (and it has), the highest price target on the S&P 500 for year-end 2024 is 5100.  An S&P 500 over 5000 feels like a pipe dream, but it would only be a 2% annual gain over the previous three years.

This is all to say that we remain bullish in the near-term, as we have since January 12th, 2023 when we got our breakaway momentum signal.  Hope everyone had a great Thanksgiving!

– Adam

Nothing Makes Sense

“It’s no wonder that truth is stranger than fiction.  Fiction has to make sense” – Mark Twain

For this month’s commentary, let’s try and unpack some of what’s going on.

Market participants are all asking three questions.

  1. Will inflation/prices come down?
  2. How high will the Federal Reserve raise rates?
  3. Will there be a recession?

Respectfully, these are not the things that matter.  We can’t know the answers to these questions, and even if we knew the answers to these questions, do we think we would be able to use that knowledge to build a portfolio that has stronger staying power than what we’ve built now?  Once you start to get past the idea that if you had tomorrow’s news, we’d be a step ahead, you start to realize we can only focus on the market that’s in front of us.  So let’s dig in a bit more on some charts (my favorite).

  • Our largest single individual holding across our entire client base just so happens to be the best-performing major fixed-income asset class in the world: T-Bills.
Image
Past Performance is not indicative of future results.

As long as the market is going to give us a 5.5% annualized return with virtually no risk, it’s going to remain a healthy portion of diversified portfolios.  An upside down world has given us the opportunity to have one of the safest and also one of the best returns from the same investment.  That doesn’t happen very often.  And won’t last forever.

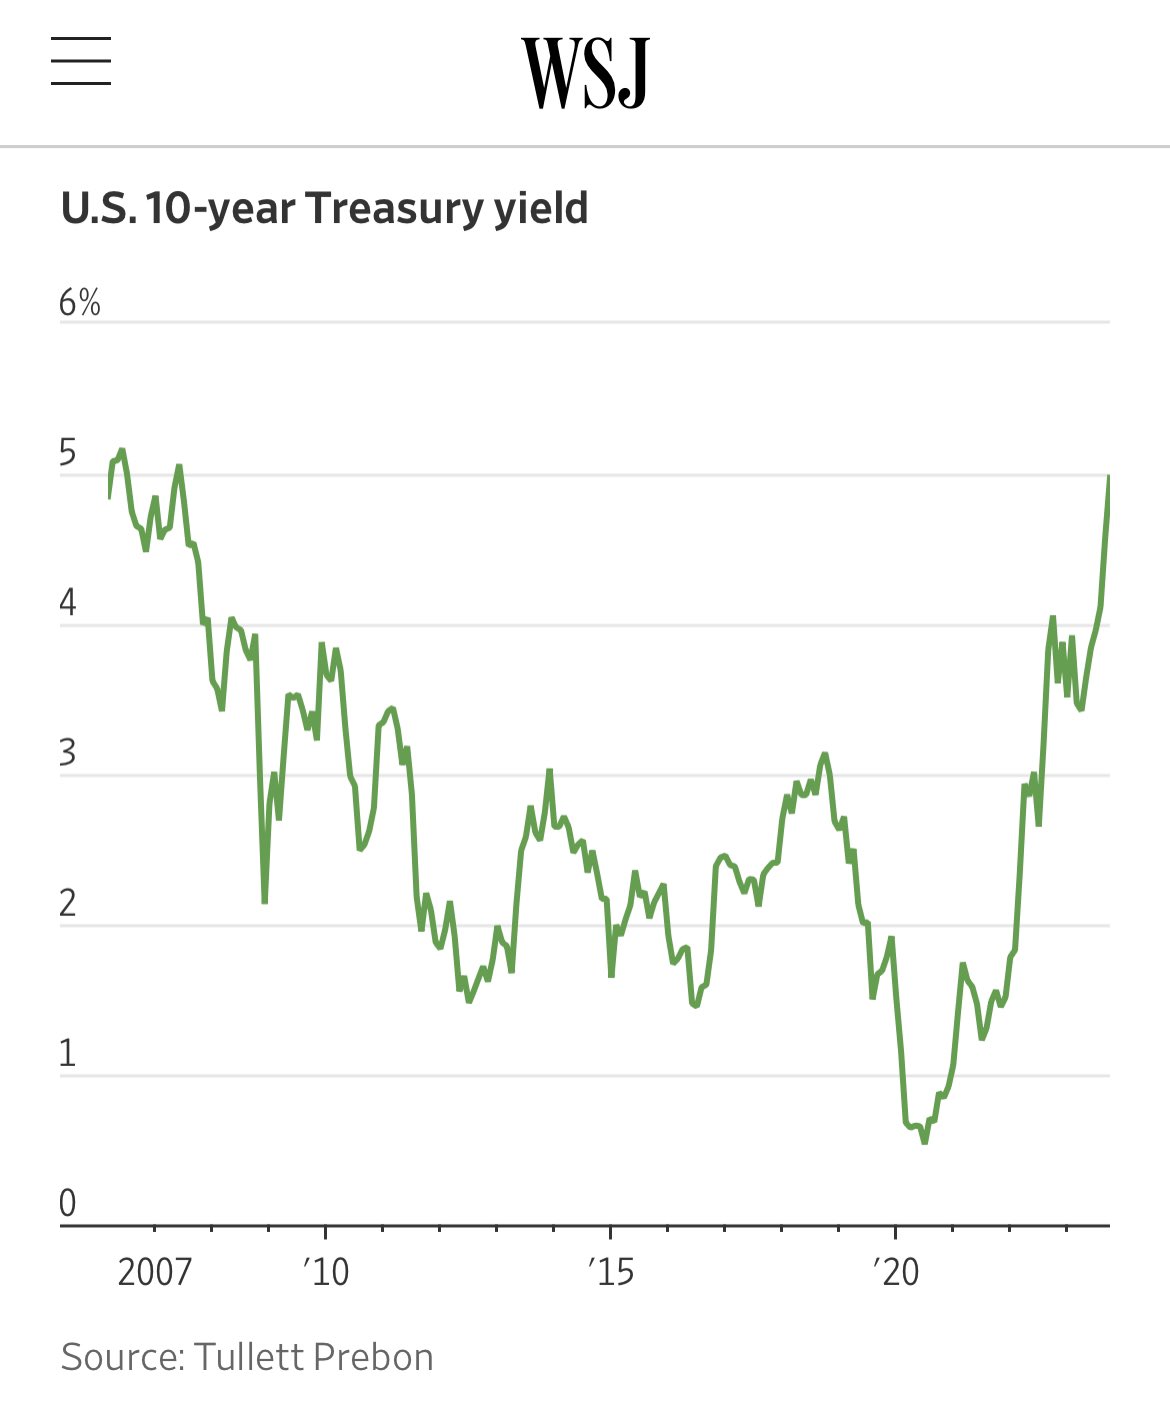
  • The 10-year Treasury Yield is above 5% for the first time in 16 years.

    Image
    Past Performance is not indicative of future results.

“The bond market shows that we have exited what once was considered ‘the new normal’ and considering economic forces that could keep yields high for years: global warming, the transition to green energy, deglobalization, demographic shifts and, of course, the ever-growing supply of government bonds – the free money experiment is over.” – Bank of America (h/t to Kyla Scanlon and her presentation at MIT).

“The surge in yields is the ideal excuse to crystallize fears over everything: the durability of the economic expansion, equity valuations, the size of federal deficits, the health of banks and whatever else gets the butterflies fluttering in the gut.” – Michael Santoli, CNBC senior market commentator (and one of the few you should be listening to on financial TV).

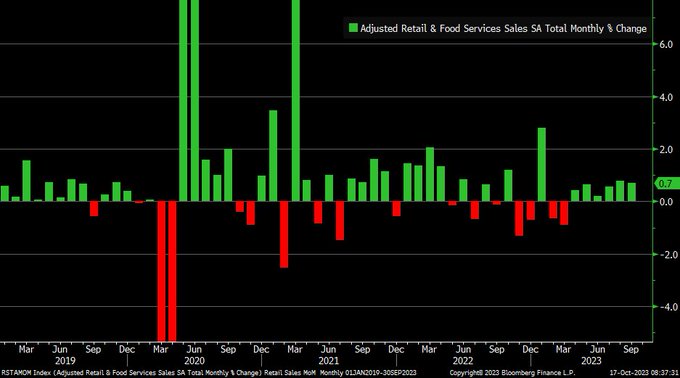
  • Are we going into a recession?  Not as long as people continue to spend like this.
Image
Past Performance is not indicative of future results.

According to Liz Ann Sonders, chief investment strategist at Charles Schwab, retail sales have been up for six consecutive months…a streak not seen since early-mid 2019.  Consumer stays strong…for now.

Yet certain parts of the stock market is already priced like we’re in a recession.  Small caps are trading at the same relative valuation as they were during the depths of the global financial crisis in 2008.  We continue to look to build larger positions in small caps over the coming months, but so far, we’ve been early (read: we’ve been wrong).

Image
Past Performance is not indicative of future results.
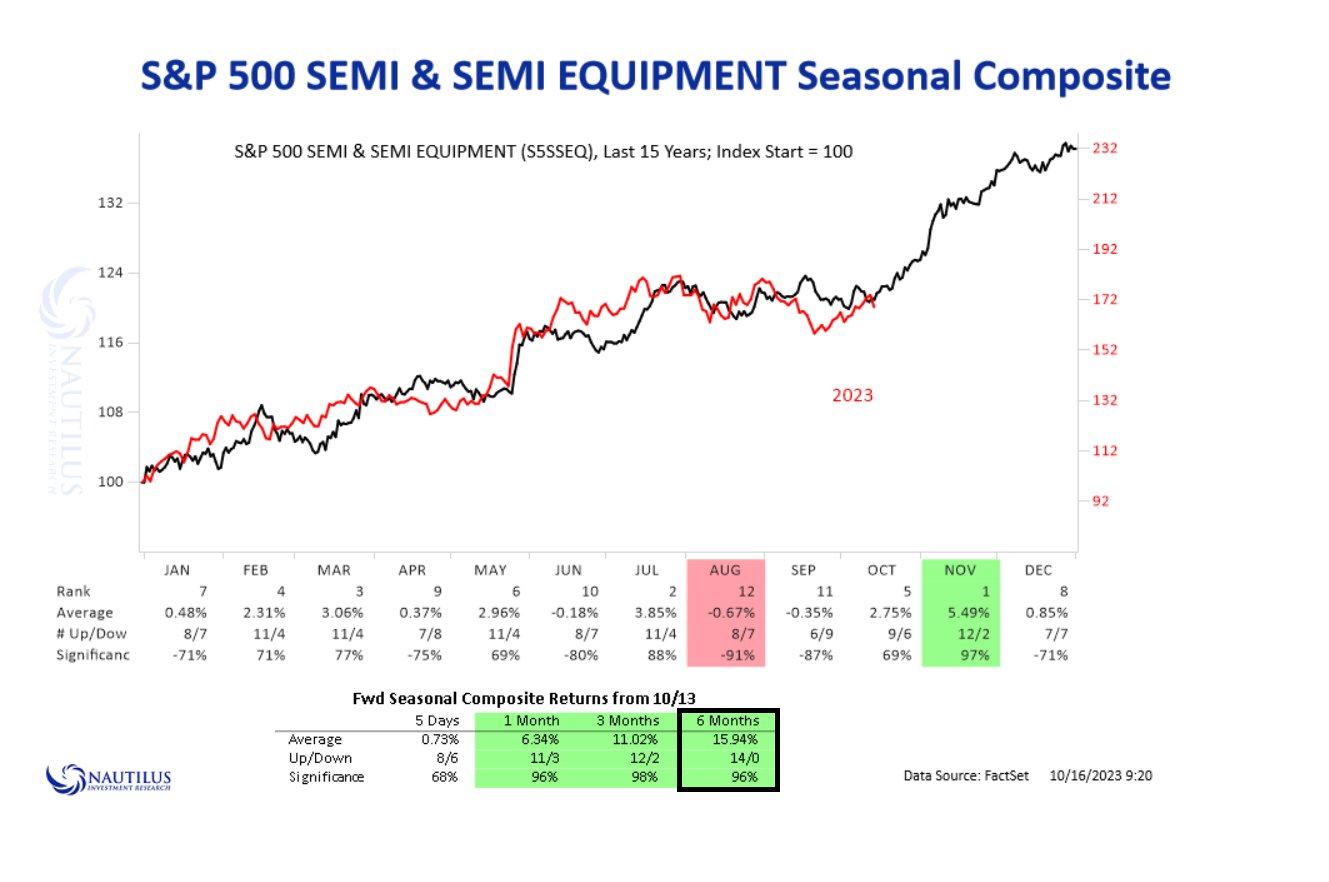
  • What’s working in the stock market today?  Semiconductors (AI) and energy.
Image
Past Performance is not indicative of future results.

The chart above from Nautilus Research, shows that over the last 14 years, the semiconductor index was higher all 14 times from the months of November to May.

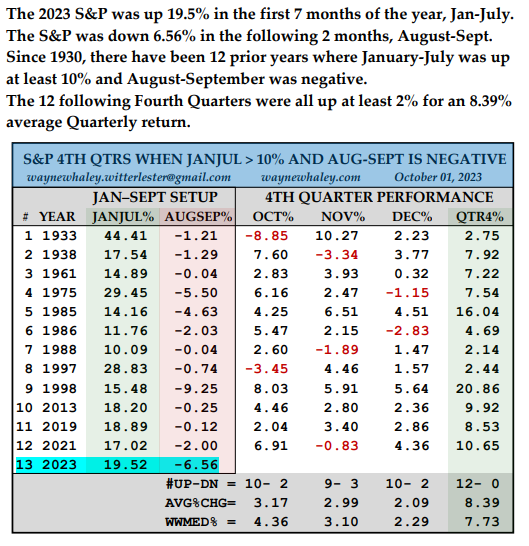
  • Are there any historical periods that mimic the period we’re in now?
Image
Past Performance is not indicative of future results.

In the last 100 years (by the way, interest rates went up and down through these periods, too), when the first half of the year was very strong (up more than 10%) and we had a summer lull (Aug and Sep were lower), the fourth quarter of the year was up 12 times out of the last 12.

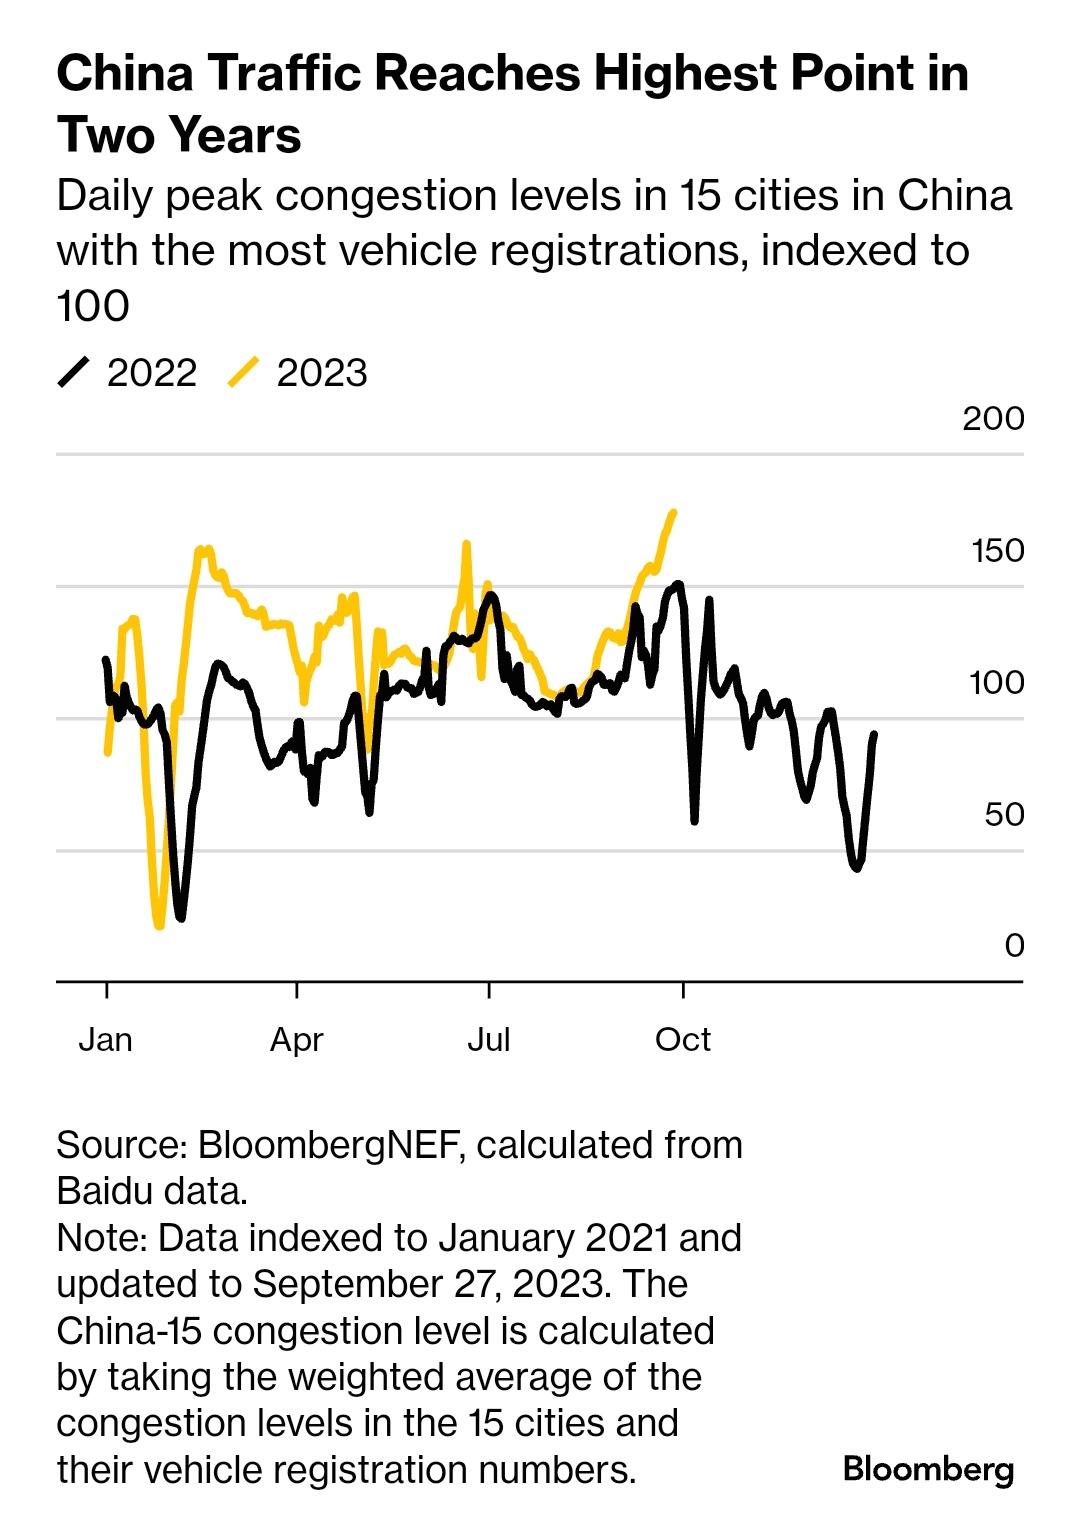
  • Yeah, but energy is only up because of the war in the Middle East.  Well…
Image
Past Performance is not indicative of future results.

Perhaps the largest population center on the planet may be coming back in a bigger way than anyone is talking about right now.  Something to watch.

We have no idea “why” these things happen.  All we know is that they DID happen.  Once we start refocusing our attention on what we know vs. what we think vs. what we can prove, only then can we start to match our short-term stock market thesis with each person’s individual goals.

May we live in interesting times,

Adam

Word On The Street

“But I come from out there, and everybody out there knows, everybody lies: cops lie, newspapers lie, parents lie. The one thing you can count on – word on the street… yeah, that’s solid.” – Christopher Walken, Suicide Kings

For this month’s blog, I thought I would give you a glimpse into the conversations we’ve been having with clients lately.

    1. “It feels like my account really hasn’t gone much of anywhere.”

That’s because it’s true.  To be honest, the average stock hasn’t gone much anywhere.  The equal-weighted S&P 500 is trading at the exact same price as March of 2021.  Year-to-date, it’s up 1%.

“But, Adam, the actual S&P 500 is up more than 11% this year.”

Thanks to the Magnificent Seven.

Image
Source: Mike Zaccardi. Past performance is not indicative of future results

Diversification means always having to say you’re sorry.

2. “Should I be worried about another government shutdown?”

Sure.  I worry about a myriad of potential risks to client portfolios each day.  Most of them don’t make to the level of “actionable”, but I’m always happy to go down the rabbit hole.  Let’s take a look at how the S&P 500 has done in previous government shutdowns (which happens on average about every 2.5 years).

Image
Source: Ryan Detrick, Carson Group. Past performance is not indicative of future results.

Looks to me like the average return during shutdowns is slightly positive, and looking 12 months out, it’s about 12% higher (again, on average).

The reason we pay attention to the stock market on a day-to-day basis isn’t to inundate ourselves with the noise of short-term price fluctuations, but rather to glean additional insights about the human condition and how crowds react.  In short, we love learning.

3.  “Is there any better opportunities out there than 5.5% Treasury Bills?”

Of course.  In hindsight they will be easy to see (and easy to convince yourself that you could have seen them).  But chasing the flavor of the quarter is not sustainable.

Said brilliantly recently by Sam Ro of TKer, “If only 20% of large-cap equity fund managers beat the S&P 500 over the past three years, then being in an S&P 500 index fund means you would’ve beaten 80% of the professional money managers during the period.”  This reminds me of the story where a 6-foot tall man drowned in a lake that was on average, 4-feet deep.

We have more than enough potential headwinds on the horizon (interest rates, degloballization, government dysfunction, striking union workers, etc.).  Try not to make this harder than it needs to be.  Sometimes, boring is sexy.

– Adam

Steady, As She Goes

Hi all,

As we wrote last month, we remained cautious on the overall market outlook, mostly due to rising valuations as well as concentration of the largest stocks in the market (now coined the Magnificent Seven, great movie, btw).   Well, with Apple down 8%, Netflix down 4%, and Microsoft down 3.5%, we’ve seen very traditional seasonal weakness from the large cap leaders.  The current consensus continues to suggest that higher interest rates will continue to work its way through the system and keep a lid on the economy as a whole.  While we believe this generally, a strong and resilient economy should be taken as a positive, not a negative.

Looking at some historical context, we turn to some research from Callie Cox, investment analyst at eToro, for our first monthly dose of reality.

Image
Disclaimer: Past performance may not be indicative of future performance

As you can see from the scatter plot above, when the 10-year yield climbs more than .5% in a month, returns over the next 12 months are mixed, but, on average, still higher.

So, we’ve been expecting a pullback and we got one.  Now what?  As long term readers of our monthly posts will know, here at Second Level Capital, while we discourage continuous market timing (overtrading), we do feel it is possible for longer-term investors to find better entry points into the market to get their target allocations and certainly see the merit in periodic rebalancing.  In order to do this, we focus mostly on the behavioral side of the market.  When others are fearful, we become more interested.  When others are talking about generational opportunities to speed up the compounding process (*cough* artificial intelligence *cough*), we become more skeptical and try to insert some rationality and see if it passes the smell test.

The tough part about this is quantifying how investors FEEL.  While the overall S&P fell about 6% from peak to trough over the last month, confidence has fallen off a cliff.  As seen below, the weekly survey figures from the North American Asset Managers has gone from 100 earlier this month, to now just above 30.  For context, the last time we saw readings this low was last October (just after the market made its low).

Image
Disclaimer: Past performance may not be indicative of future results

As it stands right now, it’s just about as textbook of a pullback as you would want if you believe we are in the early stages of another bull market (as we do).  When price doesn’t drop that much, but sentiment falls off a cliff, it sets the stage for the next advance.

We continue to emphasize value sectors over growth (energy and healthcare, specifically) and smaller companies over larger ones (valuation remains reasonable in the smallcaps), we are anticipating a rally into year-end that could feasibly take the S&P 500 to new highs.

In the back of our mind, there is some doubt that remains, so as Cormac McCarthy wrote, “if trouble comes when you least expect it then maybe the thing to do is to always expect it”.  We’re keeping our eyes open for anything that may change our tune, but until then, let the market show us the way.

Sincerely,
Adam


The Trend Is Your Friend

Hi Everyone,

I spent a decent portion of my early career (and my own money) trying to fight the prevailing trend.  The seduction of catching a bottom, or calling a top was just too much for my young mind to pass up.  Sometimes, the market just didn’t make sense.  In 2009, as the market attempted to bounce in March, the global economy was in ruins.  The banks had started to fail, recession was the talk of the town, and commercial real estate was the next shoe to drop (sound familiar?).  As the market continued higher, I was certain the trap door was going to fall out of the bottom once again, just as it had done twice in 2008.  But it didn’t.  It continued to climb the proverbial wall of worry, closing higher by 23% for the year, and almost 70% higher than the intraday low in March 2009.  The experience of trying to trade a market I wanted, instead of the one that was in front of my face was invaluable, sowing the seeds for our playbook in 2020, which helped us navigate the COVID crisis.

That early experience set the stage for everything that came after (including Second Level Capital).  Learning how to take emotion out of analysis.  Trading the market as it is.  Being less concerned about missing out on the next move, knowing there will always be another entry.  Ebbs and flows in the business cycle are always for different reasons, but the human nature embedded in our own fear and greed remain the same.  Learning how to quantify these emotions to produce potential opportunities is likely to be our main focus for the foreseeable future.

While we remain cautious there will be a pullback in the next month or two, there is ZERO evidence it is imminent.  Could be today, could be next week, could be after the S&P 500 makes a new all-time high.  No one knows.  No one.  There are a few pieces of data that have caught our eyes, suggesting this may not be the greatest time to put new capital to work, but we will continue monitoring and if anything presents itself, we will reach out.

That’s it for this month, and a special happy birthday shout out to Second Level Capital.  It’s been 5 years, this month.  Can’t believe it, and we can’t thank all of you enough.

Stay Cool,

Adam

Summer Breeze

Hi all,

In last month’s post, we mentioned struggling with the idea of whether or not to follow our conviction of rotating from technology to cyclicals (large companies to smaller ones).  We decided to wait for additional signs of the market rotation before making any substantive changes.  It was a good move.  With a week left to go, the Nasdaq 100 is up another 4.5% this month, extending a rally that has gone further than almost any analyst had predicted at the start of the year (why do we listen to these meteorologists?).  So we’re in the same spot today as we were a month ago:  Knowing that a pullback/decline is coming, but waiting until we see the turn before rebalancing portfolios since we believe this rally may have a little more juice left in it.

Without much change to our overall view, here’s a few research pieces of note from this month.

  1. The S&P 500 is up around 10% for the year.  In the past 70 years, when the S&P is up 10% or more at the end of June, the final six months are up, on average, 82% of the time, with an average return of 7.7%.  A good first half usually means a good second half.
Image
past performance is not indicative of future results

2. The market has broadened out somewhat this month, but it’s still top heavy.  This isn’t uncommon for the stock market, but it’s something to watch.  Ideally we would want to see the “unloved” names participate in the rally to make us feel more comfortable (energy, real estate, small caps).  Unfortunately, the market doesn’t care about our comfort level.

Image
past performance is not indicative of future results

3.  Adding to our feeling that the market may still have a little higher to go is the percentage of advisors that are still underweight equities (nervous and sitting in 5% treasuries).  If the market were to continue to drift higher, it’s very possible that clients become fearful of missing out on the next bull market run (FOMO) and decide to jump back into the market on any pullback, large or small.

Image
past performance is not indicative of future results

Summer has officially arrived in St. Louis with temperatures nearing 100 degrees this week.  Hopefully, everyone is staying cool and as always, we’re here if you need anything.

– Adam

Image preview

My Own Worst Enemy

Hi All,

I’m phoning it in this month as I was all ready to write a post about the rotation we believe may be occurring before our eyes (small caps playing catch up to large caps), but I’m just not quite convinced that this means large caps will go down.  So rather than being precisely wrong, we’ve decided to try and be generally right and wait it out a bit.

Below is a tweet thread from Jim O’Shaughnessy.  Jim is founder of O’Shaughnessy Asset Management, and a pioneer in quantitative investing (computer driven modeling).  Now that computerized trading has become ubiquitous, he’s one of a large crowd, but most important to me are his opinions on the behavioral side of investing.  His views most clearly mirror mine, and it’s a bit long-winded, but it’s important to realize how our emotions will always remain our greatest weakness and our greatest source of opportunity.

Happy reading everyone, and congrats to all the graduates out there!

– Adam

Markets change minute-by-minute. Human nature barely changes millennium-by-millennium. There’s your edge.

How To Arbitrage Human Nature: A thread

People want to believe the present is different than the past. Markets are now computerized, high-frequency and block traders dominate, the individual investor is gone and, in his/her place, sit a plethora of huge mutual funds and hedge funds to which he has given his money. Many have simply given up trying to earn alpha in the market and have given their money to index funds. Some people think these masters of money make decisions differently and believe that looking at how a strategy performed in the 1950′s or 1960′s offers little insight into how it will perform in the future. But while we humans passionately believe that our own current circumstances are somehow unique, not much has really changed since the unarguably brilliant Isaac Newton lost a fortune in the South Sea Trading Company bubble of 1720. Newton lamented that he could “calculate the motions of heavenly bodies but not the madness of men.” Herein lays the key to why basing investment decisions on long-term results is vital: the price of a stock is still determined by people.

If you chart price of the South Sea company’s stratospheric rise and then compare it with the NASDAQ in the 1990′s, you’ll see they are virtually identical. As long as people let fear, greed, hope and ignorance cloud their judgment, they will continue to misprice stocks and provide opportunities to those who rigorously use simple, time-tested strategies to pick stocks. Unless you believe that human nature will fundamentally change soon, using long-term studies of which stocks do well and which do poorly lets you arbitrage human nature. Newton lost his money because he let himself get caught up in the hoopla of the moment and invested in a colorful story rather than the dull facts. Names change. Industries change. Styles come in and out of fashion, but the underlying characteristics that identify a good or bad investment remain the same.

Each era has its own group of stocks that people flock to, usually those with the most intoxicating story. Investors of the twenties sent the Dow Jones Industrial Average up 497% between 1921 and 1929, buying into the “new era” industries such as radio and movie companies. In 1928 alone, gullible investors sent Radio Corporation from $85 to $420 per share, all based on the hope that this new marvel would revolutionize the world. In that same year, speculators sent Warner Brothers Corporation up 962 percent—from $13 to $138—based on their excitement about talking pictures and a new Al Jolson contract. The 1950s saw a similar fascination in new technologies, with Texas Instruments soaring from $16 to $194 between 1957 and 1959, with other companies like Haloid-Xerox, Fairchild Camera, Polaroid and IBM being beneficiaries of the speculative fever. Closer to home, remember all the dot.coms of the late 1990s that soared on little more than a PowerPoint presentation and a lot of sizzle? And, of course, now we have Bitcoin…

The point is simple. Far from being an anomaly, the euphoria of the late 20’s; 60’s and 90’s were predictable ends to a long bull markets, where the silliest investment strategies often do extraordinarily well, only to go on to crash and burn. A long view of returns is essential because only the fullness of time uncovers basic relationships that short-term gyrations conceal. It also lets us analyze how the market responds to a large number of events, such as inflation, stock market crashes, stagflation, recessions, wars and new discoveries. From the past the future flows. History never repeats exactly, but the same types of events continue to occur. Investors who had taken this essential message to heart in the last speculative bubble were the ones least hurt in the aftermath. They understand that today’s events and news are mostly noise, and that only longer periods of time deliver the much more accurate signal. As Pericles said, they “wait for the wisest of all counselors, time.”

The same is true after devastating bear markets. Investors behave as irrationally after protracted bear markets as they do after market manias, leaving the equity markets in droves, usually at or near the market’s bottom. By the time they gather enough courage to venture back into equities, a good portion of the recovery has often already happened. Investors who remained on the sidelines in 2009 left between 50 and 75 percent of gains on the table, making it very difficult for them to catch up with the market. We are always trying to second guess the market, but the facts are clear—Our emotions and biases are toxic to good long-term performance and we *must* get them under control so that rather than letting them control us, we take advantage of them and arbitrage human nature, the last sustainable edge.

Everybody’s Nervous

Hi All,

Frequently, I get feedback from clients about our monthly blog posts, and most of the constructive criticism surrounds me talking less.  Point taken.  For this month, let’s show a few more visuals.

As you know, the majority of our market timing calls are about buying when people are scared/nervous, and trimming when investors are euphoric (or more precisely, when they start to discard the possibility of future problems).

  1.  This chart comes from the most recent Bank of America Global Fund Manager Survey.  As you can see, cash remains the highest overweight, while US stocks have been the vehicle by which they have chosen to raise that cash.
Image
Past performance is no guarantee of future results

2.  For an idea of how much cash in “sitting on the sidelines”, we again turn to Bank of America’s global research department.  We now have more cash sitting in money markets than we did at the height of the pandemic.

Image
Past performance is no guarantee of future results

3.  Why has all that cash flocked to money markets and US treasuries?  Because the federal reserve has raised interests rates at the fastest pace in US history. For years, there was no reasonable alternative to equities, but that time has passed.  With investment grade corporate bonds yielding over 5.5% and short term treasuries yielding north of 5%, there are now some very compelling choices.

Image
Past performance is no guarantee of future results

4. The relative calming and grinding upward nature of the stock market, tends to mean sunnier skies are ahead.  When the first quarter of year doesn’t go below the lowest price in December, the return for the final three quarters of the year has been higher 33 out of 36 times since 1950 (with an average return of an additional 11%).

Image
Past performance is no guarantee of future results

5. According to the most recent survey from J.P. Morgan, 95% of respondents believe the S&P has already peaked for 2023.

Image
Past performance is no guarantee of future results

As a reminder, strongly bearish sentiment DOES NOT mean that stocks will go up from here, but it absolutely tilts the weight of the evidence in favor of stocks going higher.  That’s the best we ever get in the stock market.  There are a couple market signals that are holding us back from being more aggressive in client accounts, but if/when those signals turn from red to green, we will be ready.

– Adam